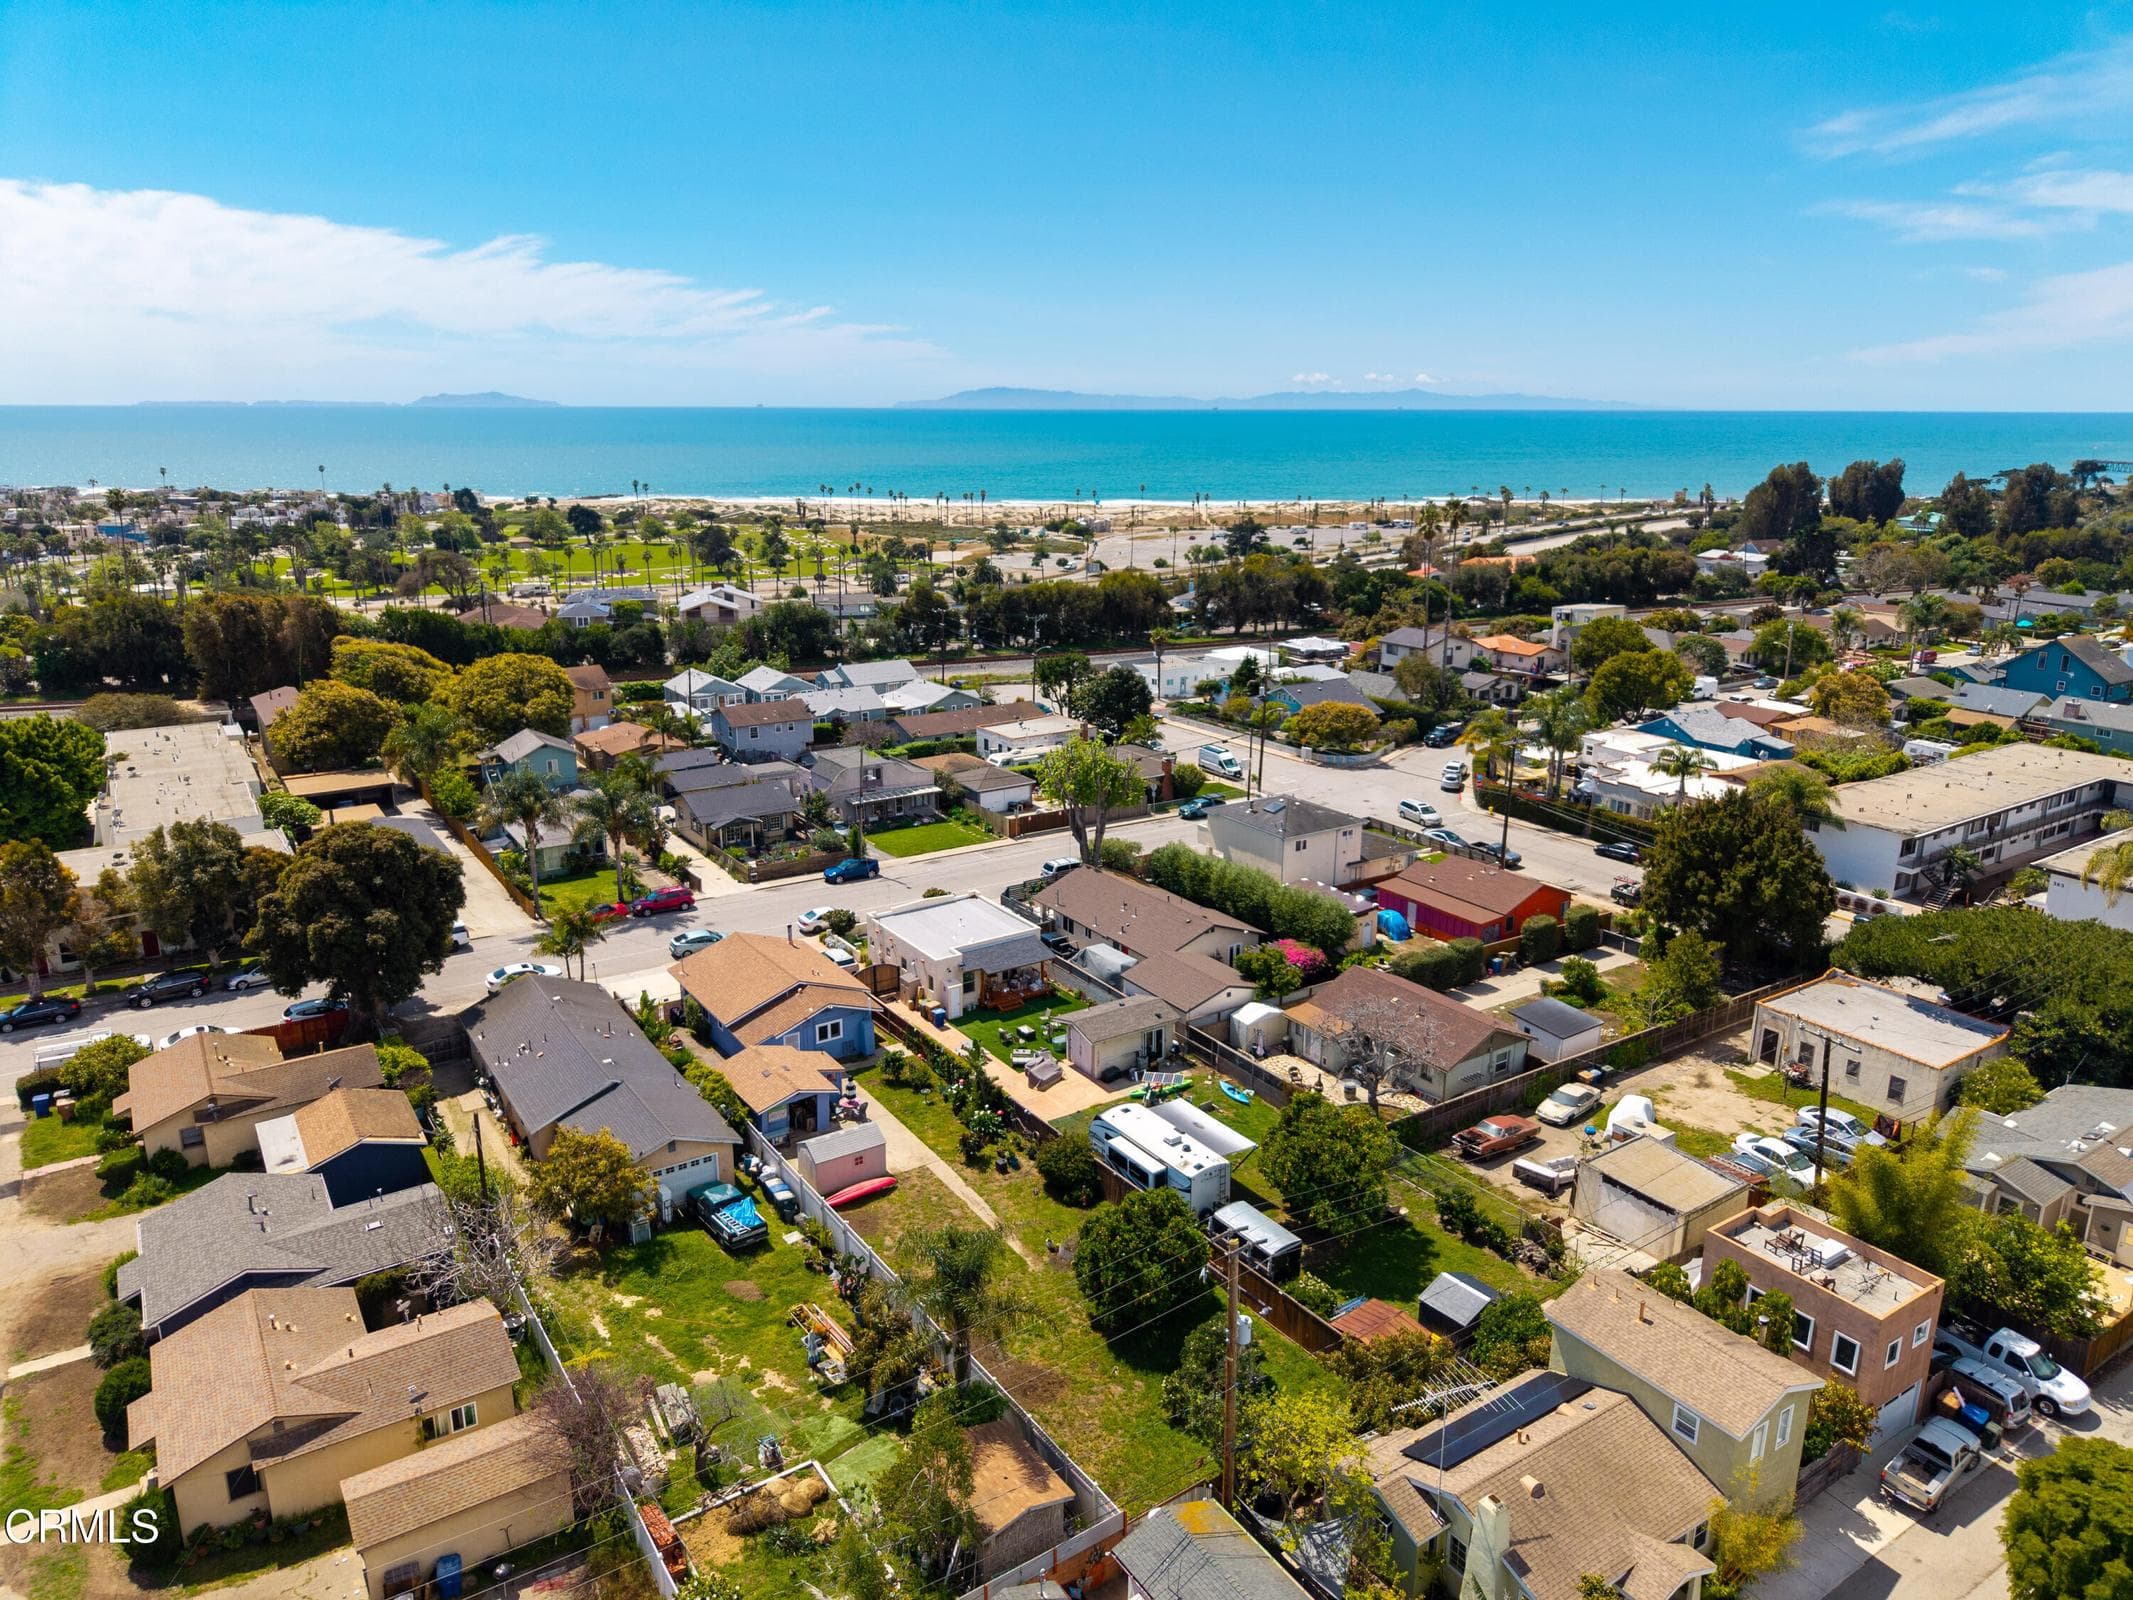
1813 Ocean Avenue, Ventura, CA 93001
1813 Ocean Avenue, Ventura, CA 93001
Property Description
Classic Ventura Mid-Town opportunity on an Extra Extra-large lot! This 3-bedroom, 1-bath home offers both charm and incredible upside, situated on a generously sized parcel where larger lots are increasingly hard to find. Zoned R3-5, this property presents exceptional potential for homeowners and investors alike to add a duplex or multi unit, making it a rare value-add opportunity in a prime location. Ideally located in Ventura's desirable Mid-Town neighborhood, just a couple minutes to Downtown Ventura, local shops, dining, and with outstanding proximity to the Beach. Enjoy convenient access to the 101 freeway without the noise, making commuting a breeze. Santa Barbara is approximately 30 miles up the coast, while Malibu is about 40 miles south, placing you in the heart of the California coastline lifestyle.
Features & Amenities
Property Details
Mortgage Calculator
Current Rates
Comparative Market Analysis
Affordable Tier · 5 active · 5 closed
Ventura · Single Family Residence
Listed 7.4% above the median closed sale of $977,500. Price per sqft ($921) is a 14% discount to closed comps ($1,065). Closed comps sold at 106% of list — strong seller's market. Comparable homes are moving quickly (avg 29 days on market).
Price Position
Positioned above the market — commands a premium.
Active Properties (5)
Active Comparables
| Address | City | Year | BD | BTH | SqFt | LotSz | LP/SqFt | LP | DIM | Score |
|---|---|---|---|---|---|---|---|---|---|---|
| 1692 Santa Ynez Street | Ventura | 1926 | 3 | 2 | 1,110 | 6,098 | $1,050 | $1.17M | 3 | 90 |
| 199 Catalina Street | Ventura | 1926 | 2 | 1 | 996 | 5,570 | $1,063 | $1.06M | 47 | 86 |
| 293 Jordan Avenue | Ventura | 1915 | 3 | 2 | 1,537 | 5,401 | $618 | $950,000 | 3 | 80 |
| 2619 Ocean Avenue | Ventura | 1951 | 2 | 2 | 1,264 | 5,703 | $854 | $1.08M | 61 | 75 |
| 221 Brent Street | Ventura | 1951 | 3 | 2 | 1,444 | 7,056 | $620 | $895,000 | 18 | 74 |
| Total: 5 · Average | 2.6 | 1.8 | 1,270.2 | 5,965.6 | $841 | $1.03M | 26.4 | |||
| Median | 1,264 | $1.06M | ||||||||
Closed Properties (5)
Closed Comparables
| Address | City | Year | Date | BD | BTH | SqFt | LotSz | LP | SP | SP/SqFt | SP/LP | DIM | Score |
|---|---|---|---|---|---|---|---|---|---|---|---|---|---|
| 1991 Evans Avenue | Ventura | 1937 | 05/13/2026 | 2 | 1 | 1,072 | 5,227 | $939,000 | $951,000 | $887 | 1.01 | 27 | 81 |
| 529 Catalina Street | Ventura | 1925 | 06/26/2026 | 2 | 1 | 720 | 4,791 | $825,000 | $1.02M | $1,424 | 1.24 | 31 | 79 |
| 24 Kalorama Street | Ventura | 1930 | 06/26/2026 | 2 | 2 | 1,027 | 4,791 | $1.09M | $1.18M | $1,149 | 1.08 | 29 | 78 |
| 214 Katherine Drive | Ventura | 1941 | 02/20/2026 | 3 | 2 | 1,126 | 6,098 | $995,000 | $977,500 | $868 | 0.98 | 35 | 76 |
| 331 Eva Street | Ventura | 1951 | 09/17/2026 | 2 | 1 | 964 | 6,534 | $949,000 | $960,000 | $996 | 1.01 | 23 | 76 |
| Total: 5 · Average | 2.2 | 1.4 | 981.8 | 5,488.2 | $1.02M | $1.02M | $1,064.8 | — | 29 | ||||
| Median | 1,027 | $977,500 | $977,500 | ||||||||||
Market Analysis
List vs Sale $/SqFt
Sale Price Trend
Days on Market
Sale vs List Price
This analysis was generated automatically from MLS data. For an in-depth, human-reviewed valuation, contact Joseph Sardella at josephsardella@gmail.com.