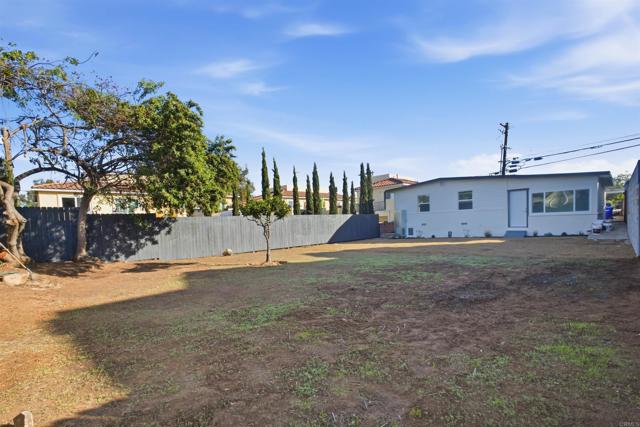
1810 Granger Avenue, National City, CA 91950
1810 Granger Avenue, National City, CA 91950
Property Description
Freshly renovated, centrally located, and ready for its next chapter! Welcome to 1810 Granger Avenue, where modern upgrades meet everyday convenience in National City. This beautifully transformed 4-bedroom, 2-bathroom home offers a fresh start with a brand-new kitchen, stunningly renovated bathrooms, and thoughtful updates throughout. Every space has been refreshed to create a move-in-ready home you can enjoy from day one. Step outside to a generously sized backyard with plenty of room to entertain, host weekend BBQs, create your dream outdoor oasis, or simply enjoy the extra space. And the location? Just as impressive! Centrally situated with convenient freeway access, you're only a short drive from shopping, dining, and everything San Diego has to offer. All the upgrades you want, the outdoor space you've been looking for, and a location that keeps you connected. This is one you won't want to miss!
Features & Amenities
Property Details
Mortgage Calculator
Current Rates
Comparative Market Analysis
Affordable Tier · 5 active · 5 closed
National City · Single Family Residence
Listed in line with the median closed sale of $780,000. Price per sqft ($751) is a 13% premium to closed comps ($666).
Price Position
Aligned with the market — fair pricing for the comps.
Active Properties (5)
Active Comparables
| Address | City | Year | BD | BTH | SqFt | LotSz | LP/SqFt | LP | DIM | Score |
|---|---|---|---|---|---|---|---|---|---|---|
| 2463 Rancho Drive | San Diego | 1948 | 3 | 2 | 1,185 | 7,200 | $608 | $720,000 | 135 | 80 |
| 1418 17Th Street | National City | 1953 | 2 | 1 | 990 | 6,534 | $707 | $700,000 | 6 | 79 |
| 2959 Ridgeway Drive | National City | 1931 | 3 | 2 | 1,300 | 7,941 | $576 | $749,000 | 4 | 77 |
| 2628 Fenton Pl | National City | 1958 | 3 | 3 | 1,376 | 12,522 | $639 | $879,900 | 56 | 72 |
| 2325 14Th Street | National City | 1977 | 3 | 2 | 1,514 | 6,534 | $495 | $749,000 | 5 | 71 |
| Total: 5 · Average | 2.8 | 2.0 | 1,273 | 8,146.2 | $605 | $759,580 | 41.2 | |||
| Median | 1,300 | $749,000 | ||||||||
Closed Properties (5)
Closed Comparables
| Address | City | Year | Date | BD | BTH | SqFt | LotSz | LP | SP | SP/SqFt | SP/LP | DIM | Score |
|---|---|---|---|---|---|---|---|---|---|---|---|---|---|
| 1609 Orange Street | National City | 1940 | 05/04/2026 | 3 | 2 | 996 | 6,970 | $795,000 | $795,000 | $798 | 1.00 | 35 | 85 |
| 5862 Schuyler Street | San Diego | 1951 | 10/12/2026 | 3 | 2 | 1,156 | 0 | $750,000 | $705,000 | $610 | 0.94 | 61 | 83 |
| 2585 Deauville Street | San Diego | 1961 | 10/01/2026 | 4 | 2 | 1,412 | 7,300 | $795,000 | $795,000 | $563 | 1.00 | 82 | 82 |
| 6127 Winchester Street | San Diego | 1951 | 11/17/2025 | 3 | 2 | 1,072 | 6,000 | $775,000 | $780,000 | $728 | 1.01 | 156 | 80 |
| 5949 Potomac | San Diego | 1956 | 08/07/2026 | 3 | 2 | 1,218 | 8,600 | $750,000 | $770,000 | $632 | 1.03 | 43 | 79 |
| Total: 5 · Average | 3.2 | 2.0 | 1,170.8 | 7,217.5 | $769,000 | $769,000 | $666.2 | — | 75.4 | ||||
| Median | 1,156 | $780,000 | $780,000 | ||||||||||
Market Analysis
List vs Sale $/SqFt
Sale Price Trend
Days on Market
Sale vs List Price
This analysis was generated automatically from MLS data. For an in-depth, human-reviewed valuation, contact Joseph Sardella at josephsardella@gmail.com.