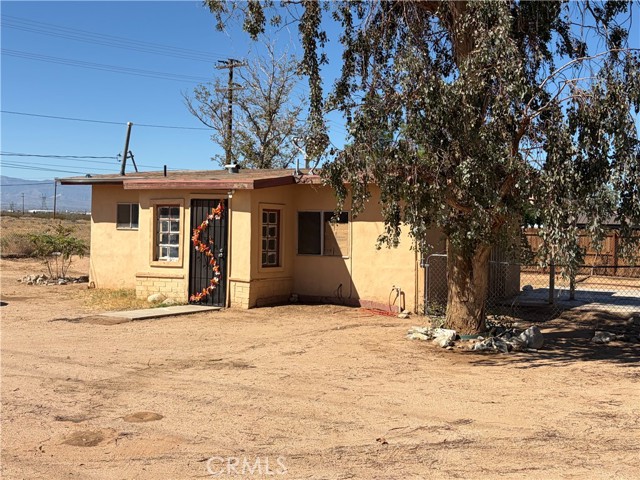
17910 Bellflower, Adelanto, CA 92301
17910 Bellflower, Adelanto, CA 92301
Property Description
The lowest priced home in the entire city. This is a great opportunity for a first time buyer, or any buyer wanting to purchase an affordable home, and add value with some improvements. This could also be a great rental opportunity as well. House is a 1 br. 1bth on a large 14,807 sq. ft fenced corner lot, with plenty of room to add on. Just minutes to the 15 freeway, and a few block away from highway 395.
Features & Amenities
Property Details
Mortgage Calculator
Current Rates
Comparative Market Analysis
Affordable Tier · 1 active · 2 closed
Adelanto · Single Family Residence
Listed 6.2% above the median closed sale of $202,500. Price per sqft ($355) is a 154% premium to closed comps ($140). Closed comps sold at 87% of list — buyers have negotiating leverage. Expect a longer timeline — comps averaged 166 days on market.
Price Position
Aligned with the market — fair pricing for the comps.
Active Properties (1)
Active Comparables
| Address | City | Year | BD | BTH | SqFt | LotSz | LP/SqFt | LP | DIM | Score |
|---|---|---|---|---|---|---|---|---|---|---|
| 10877 Chamberlaine Way | Adelanto | 1950 | 2 | 1 | 768 | 19,800 | $293 | $224,900 | 12 | 75 |
| Total: 1 · Average | 2.0 | 1.0 | 768 | 19,800 | $293 | $224,900 | 12 | |||
| Median | 768 | $224,900 | ||||||||
Closed Properties (2)
Closed Comparables
| Address | City | Year | Date | BD | BTH | SqFt | LotSz | LP | SP | SP/SqFt | SP/LP | DIM | Score |
|---|---|---|---|---|---|---|---|---|---|---|---|---|---|
| 12006 Bartlett Avenue | Adelanto | 1960 | 10/09/2026 | 2 | 1 | 1,264 | 36,038 | $225,000 | $205,000 | $162 | 0.91 | 247 | 59 |
| 12028 Chamberlaine | Adelanto | 1964 | 04/15/2026 | 4 | 2 | 1,684 | 8,318 | $239,900 | $200,000 | $119 | 0.83 | 84 | 48 |
| Total: 2 · Average | 3.0 | 1.5 | 1,474 | 22,178 | $202,500 | $202,500 | $140.5 | — | 165.5 | ||||
| Median | 1,684 | $205,000 | $205,000 | ||||||||||
Market Analysis
List vs Sale $/SqFt
Sale Price Trend
Days on Market
Sale vs List Price
This analysis was generated automatically from MLS data. For an in-depth, human-reviewed valuation, contact Joseph Sardella at josephsardella@gmail.com.