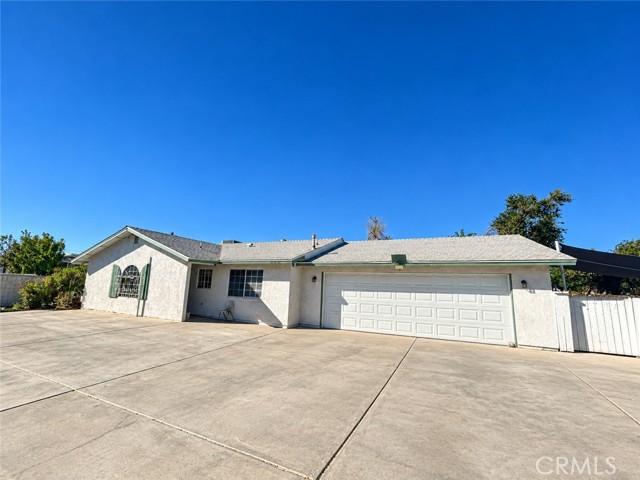
17471 Laurel Street, Hesperia, CA 92345
17471 Laurel Street, Hesperia, CA 92345
Property Description
Opportunity knocks with this beautiful house in the city of Hesperia. Situated on an 11200-sf lot home, this house comes with a garage conversion of 1 bedroom/1 bathroom that makes it a 4 bedrooms/3 bathrooms. Plenty of room all around, for your RV, boat or anything you need space for the possibilities are endless.
Features & Amenities
Property Details
Mortgage Calculator
Current Rates
Comparative Market Analysis
Affordable Tier · 5 active · 5 closed
Hesperia · Single Family Residence
Listed 10.5% above the median closed sale of $430,000. Price per sqft ($323) is a 11% premium to closed comps ($292). Closed comps sold at 103% of list — strong seller's market.
Price Position
Positioned above the market — commands a premium.
Active Properties (5)
Active Comparables
| Address | City | Year | BD | BTH | SqFt | LotSz | LP/SqFt | LP | DIM | Score |
|---|---|---|---|---|---|---|---|---|---|---|
| 17392 Poplar | Hesperia | 1978 | 3 | 2 | 1,608 | 28,000 | $271 | $435,000 | 9 | 85 |
| 18047 Yucca St | Hesperia | 1985 | 3 | 2 | 1,287 | 20,000 | $319 | $409,999 | 5 | 85 |
| 8283 Langdon | Hesperia | 1986 | 3 | 2 | 1,428 | 18,000 | $287 | $410,000 | 61 | 83 |
| 17405 Adobe | Hesperia | 1987 | 3 | 2 | 1,701 | 17,200 | $279 | $475,000 | 74 | 82 |
| 8951 Avocado | Hesperia | 1991 | 3 | 2 | 1,764 | 18,800 | $247 | $435,000 | 18 | 82 |
| Total: 5 · Average | 3.0 | 2.0 | 1,557.6 | 20,400 | $280.6 | $432,999.8 | 33.4 | |||
| Median | 1,608 | $435,000 | ||||||||
Closed Properties (5)
Closed Comparables
| Address | City | Year | Date | BD | BTH | SqFt | LotSz | LP | SP | SP/SqFt | SP/LP | DIM | Score |
|---|---|---|---|---|---|---|---|---|---|---|---|---|---|
| 17434 Laurel | Hesperia | 1979 | 05/12/2026 | 3 | 2 | 1,582 | 47,957 | $489,700 | $490,000 | $310 | 1.00 | 56 | 87 |
| 8938 Evergreen | Hesperia | 1974 | 09/09/2026 | 3 | 2 | 1,300 | 19,000 | $414,990 | $415,000 | $319 | 1.00 | 54 | 86 |
| 17846 Orange | Hesperia | 1982 | 07/24/2026 | 3 | 2 | 1,292 | 25,200 | $399,900 | $415,000 | $321 | 1.04 | 65 | 85 |
| 17747 Walnut Street | Hesperia | 1979 | 06/09/2026 | 3 | 2 | 1,596 | 27,600 | $429,000 | $439,000 | $275 | 1.02 | 61 | 85 |
| 9102 Camphor | Hesperia | 1983 | 06/02/2026 | 3 | 2 | 1,816 | 25,500 | $399,000 | $430,000 | $237 | 1.08 | 46 | 83 |
| Total: 5 · Average | 3.0 | 2.0 | 1,517.2 | 29,051.4 | $437,800 | $437,800 | $292.4 | — | 56.4 | ||||
| Median | 1,582 | $430,000 | $430,000 | ||||||||||
Market Analysis
List vs Sale $/SqFt
Sale Price Trend
Days on Market
Sale vs List Price
This analysis was generated automatically from MLS data. For an in-depth, human-reviewed valuation, contact Joseph Sardella at josephsardella@gmail.com.