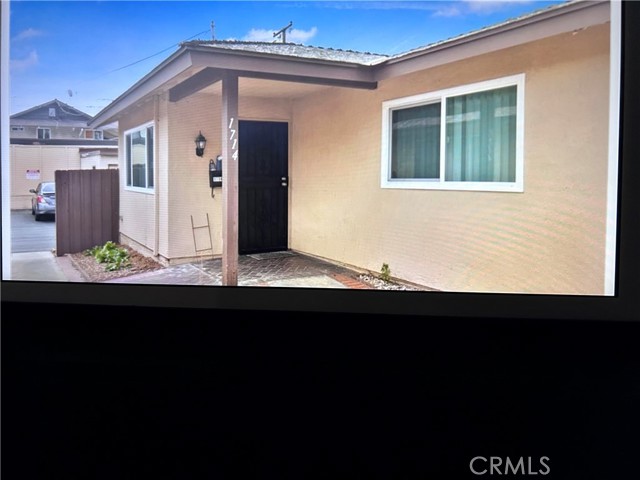
1 / 3
1714 Appleton, Pomona, CA 91767
$370K2bd · 2ba · 1,036 sqft
Lot 1,865 sqft•HOA $324/mo•Townhouse•Active•23d on market•MLS# MB-26220709
1714 Appleton, Pomona, CA 91767
MLS# MB-26220709•Residential•Townhouse
Active23 days on market
$370,000
2
Beds
2
Baths
1,036
Sq Ft
1,865
Lot Sq Ft
$324
HOA/mo
1968
Year Built
None
View
Property Description
Short sale, subject to 2 lenders approval, selling in AS IS condition, with tenants in place
Features & Amenities
FeeBuilt 1968
Property Details
Land Type
Fee
Year Built
1968
Property Type
Residential
Property Subtype
Townhouse
Parking Spaces
1
Garage Spaces
1
Heating
Central
Cooling
Central Air
View
None
City
Pomona
Zip Code
91767
County
Los Angeles
Mortgage Calculator
Current Rates
$
$
%
Monthly Payment
$1,870.92
Principal & Interest
Loan Amount
$296,000
Total Interest
$377,532
Total Payment Over 30 Years
$673,532
This calculator provides estimates only. Actual mortgage payments may include taxes, insurance, HOA fees, and PMI. Contact a lender for accurate quotes.
Comparative Market Analysis
Affordable Tier · 1 active · 3 closed
1714 Appleton, Pomona, CA 91767
Pomona · Townhouse
$370K
Affordable TierBeds
2
Baths
2
Sqft
1,036
Lot
1,865 sqft
Year
1968
$/Sqft
$357
Pool: No✓
View: None✓
Garage: 1-car✓
Listed 11.9% below the median closed sale of $420,000. Closed comps sold at 100% of list — strong seller's market.
Price Position
Priced below the market — value advantage over the field.
Price advantage
Subject listed at $370K· $357/sqft
Total list price
Closed comps
vs closed median $420K
−$50K (−11.9%)
Active comps
vs active median $409K
−$39K (−9.5%)
Price per sqft
Closed compsinsufficient comp data
Active comps
vs active avg $/sqft $419
−$62 (−14.8%)
Active Properties (1)
Active Comparables
| Address | City | Year | BD | BTH | SqFt | LotSz | LP/SqFt | LP | DIM | Score |
|---|---|---|---|---|---|---|---|---|---|---|
| 10477 Yosemite | Montclair | 1980 | 2 | 1 | 977 | 630 | $419 | $409,000 | 59 | 77 |
| Total: 1 · Average | 2.0 | 1.0 | 977 | 630 | $419 | $409,000 | 59 | |||
| Median | 977 | $409,000 | ||||||||
Closed Properties (3)
Closed Comparables
| Address | City | Year | Date | BD | BTH | SqFt | LotSz | LP | SP | SP/SqFt | SP/LP | DIM | Score |
|---|---|---|---|---|---|---|---|---|---|---|---|---|---|
| 605 Indian Hill Boulevard | Claremont | 1962 | 07/11/2025 | 2 | 2 | 1,088 | 2,387 | $449,000 | $425,000 | $391 | 0.95 | 148 | 82 |
| 9356 Mesa Verde Drive | Montclair | 1980 | 09/24/2025 | 2 | 1 | 1,005 | 1,005 | $399,888 | $420,000 | $418 | 1.05 | 47 | 72 |
| 1197 9th Street | Pomona | 1990 | 05/15/2026 | 3 | 3 | 1,224 | 41,111 | $370,000 | $375,000 | $306 | 1.01 | 24 | 61 |
| Total: 3 · Average | 2.3 | 2.0 | 1,105.667 | 14,834.333 | $406,666.667 | $406,666.667 | $371.667 | — | 73 | ||||
| Median | 1,088 | $420,000 | $420,000 | ||||||||||
Market Analysis
List vs Sale $/SqFt
Sale Price Trend
Days on Market
Sale vs List Price
AI-generated CMA
This analysis was generated automatically from MLS data. For an in-depth, human-reviewed valuation, contact Joseph Sardella at josephsardella@gmail.com.