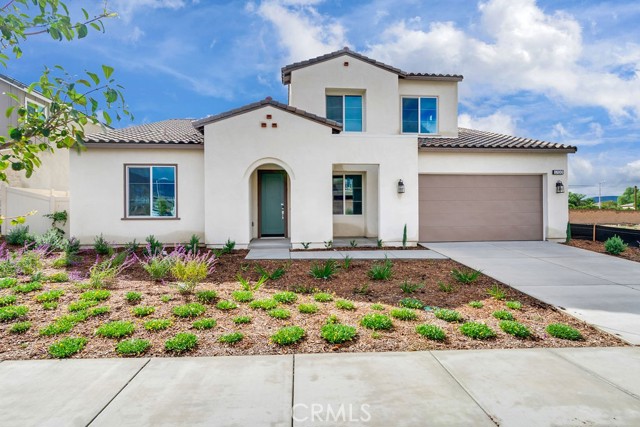
1700 Sandpiper Avenue, Redlands, CA 92374
1700 Sandpiper Avenue, Redlands, CA 92374
Property Description
Welcome to the Meadowlark Plan 2. The main level features a downstairs primary suite, a well-appointed gourmet kitchen, and a spacious walk-in pantry. Upstairs, a large bonus room and additional powder bath provide flexible space for work, play, or guests. This home has over $76K in designer upgrades. This open kitchen has upgraded cabinets, upgraded wrapped extended island, Upgraded Cafe appliances, roll out shelves, quartz counters, and so much more. Home is completed and ready for quick move in.
Features & Amenities
Property Details
Mortgage Calculator
Current Rates
Comparative Market Analysis
Luxury Tier · 5 active · 5 closed
Redlands · Single Family Residence
Listed 8.5% below the median closed sale of $982,379. Closed comps sold at 104% of list — strong seller's market. Expect a longer timeline — comps averaged 187 days on market. Luxury tier — fewer comparable sales widen the confidence range.
Price Position
Priced below the market — value advantage over the field.
Active Properties (5)
Active Comparables
| Address | City | Year | BD | BTH | SqFt | LotSz | LP/SqFt | LP | DIM | Score |
|---|---|---|---|---|---|---|---|---|---|---|
| 1570 Oriole Street | Redlands | 2026 | 5 | 4 | 3,608 | 8,470 | $268 | $966,000 | 23 | 94 |
| 1563 Pintail Street | Redlands | 2026 | 5 | 4 | 3,897 | 8,050 | $254 | $988,000 | 127 | 90 |
| 1466 Kristion Court | Redlands | 2018 | 4 | 3 | 2,726 | 7,279 | $293 | $799,000 | 17 | 87 |
| 31271 Moss | Mentone | 2005 | 4 | 3 | 3,901 | 7,220 | $204 | $795,000 | 195 | 74 |
| 1089 Tangerine Drive | Redlands | 2005 | 4 | 3 | 2,918 | 6,050 | $267 | $780,000 | 39 | 71 |
| Total: 5 · Average | 4.4 | 3.4 | 3,410 | 7,413.8 | $257.2 | $865,600 | 80.2 | |||
| Median | 3,608 | $799,000 | ||||||||
Closed Properties (5)
Closed Comparables
| Address | City | Year | Date | BD | BTH | SqFt | LotSz | LP | SP | SP/SqFt | SP/LP | DIM | Score |
|---|---|---|---|---|---|---|---|---|---|---|---|---|---|
| 1558 Oriole Street | Redlands | 2025 | 06/30/2026 | 4 | 3 | 2,813 | 8,695 | $899,000 | $838,171 | $298 | 0.93 | 322 | 95 |
| 1719 Wren Avenue | Redlands | 2025 | 01/21/2026 | 4 | 4 | 3,345 | 8,411 | $919,000 | $1.02M | $305 | 1.11 | 123 | 94 |
| 1718 Sandpiper Avenue | Redlands | 2026 | 09/23/2026 | 5 | 4 | 3,608 | 8,233 | $899,000 | $962,215 | $267 | 1.07 | 186 | 93 |
| 1731 Wren Avenue | Redlands | 2026 | 10/26/2026 | 5 | 4 | 3,897 | 8,731 | $956,982 | $982,379 | $252 | 1.03 | 234 | 92 |
| 1701 Wren Avenue | Redlands | 2025 | 02/26/2026 | 4 | 3 | 2,813 | 8,236 | $934,000 | $1.01M | $358 | 1.08 | 70 | 92 |
| Total: 5 · Average | 4.4 | 3.6 | 3,295.2 | 8,461.2 | $961,691.6 | $961,691.6 | $296 | — | 187 | ||||
| Median | 3,345 | $982,379 | $982,379 | ||||||||||
Market Analysis
List vs Sale $/SqFt
Sale Price Trend
Days on Market
Sale vs List Price
This analysis was generated automatically from MLS data. For an in-depth, human-reviewed valuation, contact Joseph Sardella at josephsardella@gmail.com.