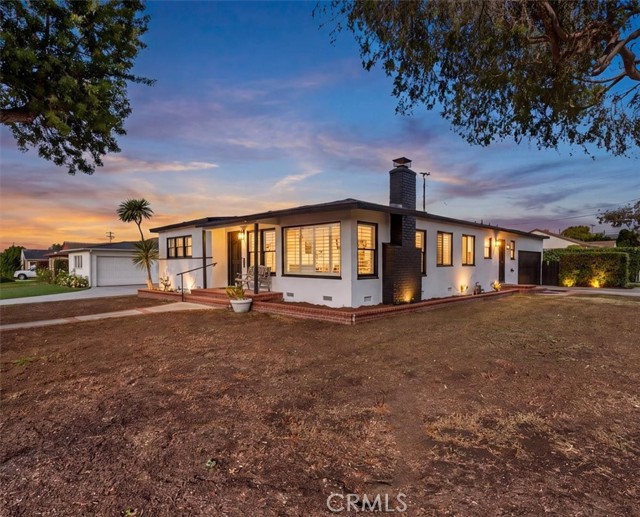
16718 Cerise, Torrance, CA 90504
16718 Cerise, Torrance, CA 90504
Property Description
Auction Price!! Welcome to this beautifully upgraded corner unit located in the desirable North Torrance area! This move-in-ready home features new flooring, a new kitchen, a new roof, and a new A/C unit, offering comfort and peace of mind for its next owner. Perfect for families, this home is situated in a clean, quiet neighborhood near top-rated schools, shopping centers, and popular restaurants. Enjoy convenient freeway access just minutes away, making commuting and everyday errands a breeze. Don’t miss this wonderful opportunity to own a beautifully updated home in a great location. Move in and enjoy!
Features & Amenities
Property Details
Mortgage Calculator
Current Rates
Comparative Market Analysis
Residential Tier · 5 active · 5 closed
Torrance · Single Family Residence
Listed 4.1% above the median closed sale of $950,000. Price per sqft ($561) is a 11% discount to closed comps ($628).
Price Position
Aligned with the market — fair pricing for the comps.
Active Properties (5)
Active Comparables
| Address | City | Year | BD | BTH | SqFt | LotSz | LP/SqFt | LP | DIM | Score |
|---|---|---|---|---|---|---|---|---|---|---|
| 3733 173rd | Torrance | 1955 | 3 | 2 | 1,238 | 5,328 | $715 | $885,000 | 4 | 87 |
| 3826 177th Street | Torrance | 1967 | 3 | 2 | 1,672 | 5,843 | $538 | $899,000 | 11 | 86 |
| 17210 Wilton Pl. | Torrance | 1954 | 3 | 2 | 1,344 | 5,087 | $718 | $965,000 | 51 | 83 |
| 15319 Faysmith Avenue | Gardena | 1944 | 3 | 2 | 1,550 | 5,849 | $645 | $999,000 | 103 | 83 |
| 15401 Faysmith | Gardena | 1947 | 5 | 4 | 2,028 | 5,837 | $528 | $1.07M | 6 | 79 |
| Total: 5 · Average | 3.4 | 2.4 | 1,566.4 | 5,588.8 | $628.8 | $963,600 | 35 | |||
| Median | 1,550 | $965,000 | ||||||||
Closed Properties (5)
Closed Comparables
| Address | City | Year | Date | BD | BTH | SqFt | LotSz | LP | SP | SP/SqFt | SP/LP | DIM | Score |
|---|---|---|---|---|---|---|---|---|---|---|---|---|---|
| 16718 Cerise Avenue | Torrance | 1952 | 06/12/2026 | 4 | 2 | 1,764 | 5,202 | $799,000 | $870,000 | $493 | 1.09 | 37 | 98 |
| 16613 Glenburn | Torrance | 1952 | 07/21/2026 | 4 | 2 | 1,625 | 5,550 | $998,800 | $950,000 | $585 | 0.95 | 42 | 95 |
| 16616 Ermanita | Torrance | 1952 | 01/16/2026 | 3 | 2 | 1,626 | 5,718 | $950,000 | $870,000 | $535 | 0.92 | 32 | 89 |
| 16621 Cerise Avenue | Torrance | 1952 | 11/26/2025 | 3 | 2 | 1,484 | 5,232 | $1.14M | $1.01M | $681 | 0.89 | 75 | 89 |
| 16703 Patronella | Torrance | 1952 | 07/31/2026 | 3 | 2 | 1,168 | 5,235 | $998,000 | $990,000 | $848 | 0.99 | 45 | 89 |
| Total: 5 · Average | 3.4 | 2.0 | 1,533.4 | 5,387.4 | $938,000 | $938,000 | $628.4 | — | 46.2 | ||||
| Median | 1,625 | $950,000 | $950,000 | ||||||||||
Market Analysis
List vs Sale $/SqFt
Sale Price Trend
Days on Market
Sale vs List Price
This analysis was generated automatically from MLS data. For an in-depth, human-reviewed valuation, contact Joseph Sardella at josephsardella@gmail.com.