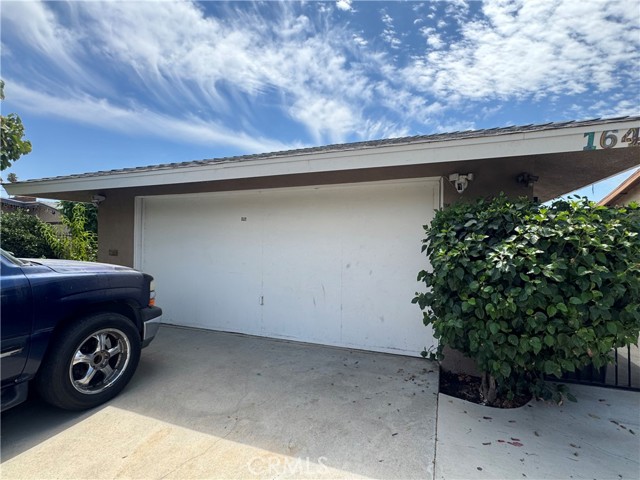
16435 Upland Avenue, Fontana, CA 92335
16435 Upland Avenue, Fontana, CA 92335
Property Description
Great opportunity in Fontana! This home offers exceptional peace of mind with extensive mechanical and structural upgrades already completed. Enjoy a newer roof (3.5 years old), a new electrical panel and fuse box (1.5 years old), a new garbage disposal (8 months old), . Energy efficiency is a major plus with leased solar panels installed 1.5 years ago. Cash or conventional buyers only. Property is sold strictly as-is. Buyer and Buyer’s Agent to conduct their own due diligence and independently verify all MLS information, square footage, and permits.
Features & Amenities
Property Details
Mortgage Calculator
Current Rates
Comparative Market Analysis
Affordable Tier · 5 active · 5 closed
Fontana · Single Family Residence
Listed in line with the median closed sale of $595,000. Price per sqft ($484) is a 18% premium to closed comps ($410).
Price Position
Aligned with the market — fair pricing for the comps.
Active Properties (5)
Active Comparables
| Address | City | Year | BD | BTH | SqFt | LotSz | LP/SqFt | LP | DIM | Score |
|---|---|---|---|---|---|---|---|---|---|---|
| 8196 Pepper Avenue | Fontana | 1964 | 3 | 2 | 1,300 | 8,775 | $461 | $599,000 | 56 | 95 |
| 16262 Ivy Avenue | Fontana | 1949 | 3 | 2 | 1,247 | 8,400 | $464 | $579,000 | 61 | 90 |
| 8296 Cypress | Fontana | 1902 | 3 | 2 | 1,172 | 11,900 | $555 | $650,000 | 88 | 88 |
| 7716 Juniper Avenue | Fontana | 1970 | 3 | 2 | 1,120 | 7,650 | $526 | $589,000 | 51 | 86 |
| 16329 Elaine Drive | Fontana | 1981 | 4 | 2 | 1,425 | 8,775 | $365 | $520,000 | 79 | 79 |
| Total: 5 · Average | 3.2 | 2.0 | 1,252.8 | 9,100 | $474.2 | $587,400 | 67 | |||
| Median | 1,247 | $589,000 | ||||||||
Closed Properties (5)
Closed Comparables
| Address | City | Year | Date | BD | BTH | SqFt | LotSz | LP | SP | SP/SqFt | SP/LP | DIM | Score |
|---|---|---|---|---|---|---|---|---|---|---|---|---|---|
| 8323 Pinyon Avenue | Fontana | 1970 | 06/05/2026 | 3 | 2 | 1,280 | 8,700 | $599,900 | $603,000 | $471 | 1.00 | 42 | 91 |
| 16563 Barbee | Fontana | 1955 | 10/14/2026 | 3 | 2 | 1,455 | 7,560 | $550,000 | $550,000 | $378 | 1.00 | 57 | 86 |
| 16212 Owen | Fontana | 1970 | 08/25/2026 | 3 | 2 | 1,598 | 10,350 | $609,999 | $595,000 | $372 | 0.97 | 150 | 85 |
| 7938 Chantry Avenue | Fontana | 1955 | 09/04/2026 | 3 | 2 | 1,479 | 7,200 | $615,000 | $620,000 | $419 | 1.01 | 98 | 84 |
| 16591 Barbee Street | Fontana | 1955 | 09/14/2026 | 4 | 2 | 1,337 | 7,560 | $590,000 | $550,000 | $411 | 0.93 | 61 | 83 |
| Total: 5 · Average | 3.2 | 2.0 | 1,429.8 | 8,274 | $583,600 | $583,600 | $410.2 | — | 81.6 | ||||
| Median | 1,455 | $595,000 | $595,000 | ||||||||||
Market Analysis
List vs Sale $/SqFt
Sale Price Trend
Days on Market
Sale vs List Price
This analysis was generated automatically from MLS data. For an in-depth, human-reviewed valuation, contact Joseph Sardella at josephsardella@gmail.com.