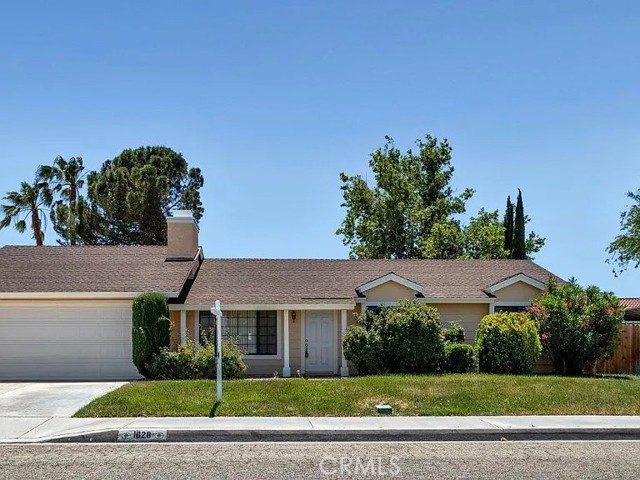
1628 West Avenue K11, Lancaster, CA 93534
1628 West Avenue K11, Lancaster, CA 93534
Property Description
Own this house with no BANK approval. No documents or records Required. Mortgage less than 3% interest. Selling my 3 bedroom 2 bathroom house with bigger than standard lot in LA area. House located in prime area of the city of Lancaster, which is about 40-45 minutes away from Downtown Los Angeles- Close enough, yet far from all LA’s crazy traffic and busy-noisy life. Great to raise a family, enjoy retirement or rent out for more than your mortgage, property tax and insurance cost together (great investment and opportunity to build one or two units on the backyard). I am selling it just a bit above the market value, because: You TAKE OVER A 2.9% MORTGAGE * NO BANK QUALIFYING * Own this home with a mortgage rate you cant get anywhere today (or ever). Estimated Value of the House: $461K Remaining Mortgage balance : ~$320K$330K Interest Rate: 2.9% fixed Down Payment: $150,000 Financing: Subject To via Land Trust Ownership: Immediate : NO BANK APPROVAL NEEDED
Features & Amenities
Property Details
Mortgage Calculator
Current Rates
Comparative Market Analysis
Affordable Tier · 5 active · 5 closed
Lancaster · Single Family Residence
Listed in line with the median closed sale of $474,900. Closed comps sold at 101% of list — strong seller's market.
Price Position
Aligned with the market — fair pricing for the comps.
Active Properties (5)
Active Comparables
| Address | City | Year | BD | BTH | SqFt | LotSz | LP/SqFt | LP | DIM | Score |
|---|---|---|---|---|---|---|---|---|---|---|
| 1631 Avenue K11 | Lancaster | 1986 | 3 | 2 | 1,299 | 6,710 | $327 | $425,000 | 11 | 92 |
| 43319 27th | Lancaster | 1987 | 3 | 2 | 1,304 | 7,000 | $330 | $429,900 | 251 | 78 |
| 3129 Brentwood | Lancaster | 1980 | 3 | 2 | 1,064 | 6,662 | $399 | $424,999 | 5 | 77 |
| 43337 Fanchon | Lancaster | 1973 | 3 | 2 | 1,476 | 7,401 | $309 | $455,900 | 11 | 77 |
| 2808 College Park | Lancaster | 1987 | 3 | 2 | 1,525 | 7,027 | $319 | $486,000 | 173 | 75 |
| Total: 5 · Average | 3.0 | 2.0 | 1,333.6 | 6,960 | $336.8 | $444,359.8 | 90.2 | |||
| Median | 1,304 | $429,900 | ||||||||
Closed Properties (5)
Closed Comparables
| Address | City | Year | Date | BD | BTH | SqFt | LotSz | LP | SP | SP/SqFt | SP/LP | DIM | Score |
|---|---|---|---|---|---|---|---|---|---|---|---|---|---|
| 43034 Weyand Court | Lancaster | 1985 | 05/15/2026 | 3 | 2 | 1,134 | 7,499 | $475,000 | $500,000 | $441 | 1.05 | 67 | 89 |
| 1809 Avenue K9 | Lancaster | 1985 | 09/25/2026 | 3 | 2 | 1,502 | 6,654 | $415,000 | $422,500 | $281 | 1.02 | 91 | 85 |
| 2017 Avenue K10 | Lancaster | 1988 | 04/27/2026 | 3 | 2 | 1,384 | 6,970 | $474,900 | $474,900 | $343 | 1.00 | 40 | 84 |
| 2082 Avenue K12 | Lancaster | 1985 | 04/14/2026 | 3 | 2 | 1,548 | 7,024 | $449,000 | $450,000 | $291 | 1.00 | 106 | 80 |
| 1807 Avenue K8 | Lancaster | 1949 | 08/12/2026 | 4 | 2 | 1,172 | 16,092 | $484,900 | $480,000 | $410 | 0.99 | 48 | 78 |
| Total: 5 · Average | 3.2 | 2.0 | 1,348 | 8,847.8 | $465,480 | $465,480 | $353.2 | — | 70.4 | ||||
| Median | 1,384 | $474,900 | $474,900 | ||||||||||
Market Analysis
List vs Sale $/SqFt
Sale Price Trend
Days on Market
Sale vs List Price
This analysis was generated automatically from MLS data. For an in-depth, human-reviewed valuation, contact Joseph Sardella at josephsardella@gmail.com.