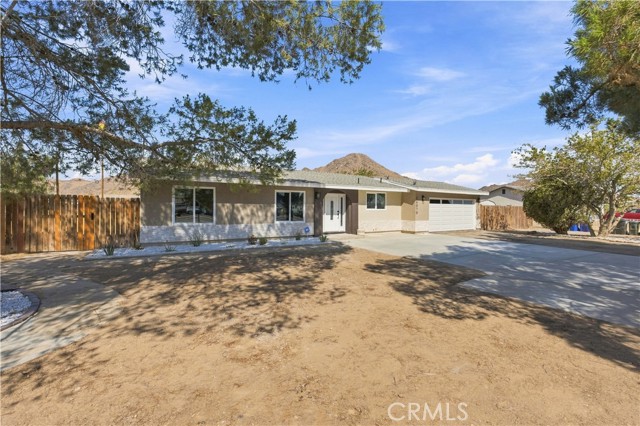
16070 Winnebago, Apple Valley, CA 92307
16070 Winnebago, Apple Valley, CA 92307
Property Description
Welcome to this beautifully remodeled 3-bedroom, 2-bathroom home in Apple Valley! Offering an updated living space on a spacious .68-acre lot, this property provides plenty of room to enjoy the desert lifestyle, bring your horses, create your dream outdoor space, or simply enjoy the extra land. The home has been completely remodeled with modern finishes throughout, offering a fresh and move-in-ready feel. A major bonus is the paid-off solar lease, helping provide added energy efficiency without the burden of a solar payment. Conveniently located near shopping, dining, and everyday amenities, while also being close to the surrounding mountains and off-road trails, this home offers the perfect blend of convenience and outdoor adventure. Whether you're looking for room to spread out, a horse property, or a beautifully updated home with plenty of possibilities!
Features & Amenities
Property Details
Mortgage Calculator
Current Rates
Comparative Market Analysis
Affordable Tier · 5 active · 5 closed
Apple Valley · Single Family Residence
Listed 8.3% above the median closed sale of $385,000. Price per sqft ($365) is a 27% premium to closed comps ($288). Closed comps sold at 102% of list — strong seller's market.
Price Position
Positioned above the market — commands a premium.
Active Properties (5)
Active Comparables
| Address | City | Year | BD | BTH | SqFt | LotSz | LP/SqFt | LP | DIM | Score |
|---|---|---|---|---|---|---|---|---|---|---|
| 15420 Apache | Apple Valley | 1978 | 3 | 2 | 1,401 | 50,750 | $285 | $399,000 | 122 | 75 |
| 15355 Straight Arrow | Apple Valley | 2026 | 3 | 2 | 1,426 | 20,080 | $316 | $450,000 | 25 | 75 |
| 16375 Sago Road | Apple Valley | 1974 | 3 | 3 | 2,043 | 19,352 | $191 | $390,000 | 46 | 69 |
| 16169 Rancherias | Apple Valley | 2022 | 4 | 3 | 2,101 | 30,009 | $190 | $399,990 | 20 | 61 |
| 20057 Rancherias | Apple Valley | 1993 | 4 | 4 | 2,536 | 28,900 | $172 | $436,000 | 50 | 55 |
| Total: 5 · Average | 3.4 | 2.8 | 1,901.4 | 29,818.2 | $230.8 | $414,998 | 52.6 | |||
| Median | 2,043 | $399,990 | ||||||||
Closed Properties (5)
Closed Comparables
| Address | City | Year | Date | BD | BTH | SqFt | LotSz | LP | SP | SP/SqFt | SP/LP | DIM | Score |
|---|---|---|---|---|---|---|---|---|---|---|---|---|---|
| 15946 Ute Road | Apple Valley | 1980 | 10/07/2026 | 3 | 2 | 1,569 | 28,200 | $389,888 | $410,000 | $261 | 1.05 | 52 | 83 |
| 16485 Dale Evans | Apple Valley | 1985 | 08/07/2026 | 3 | 2 | 1,425 | 26,360 | $369,999 | $360,000 | $253 | 0.97 | 71 | 82 |
| 20631 Zuni Rd | Apple Valley | 1983 | 12/04/2025 | 3 | 2 | 1,156 | 43,560 | $410,000 | $410,000 | $355 | 1.00 | 61 | 80 |
| 15498 Washoan | Apple Valley | 1984 | 10/02/2026 | 3 | 2 | 1,426 | 18,700 | $365,000 | $385,000 | $270 | 1.05 | 122 | 79 |
| 15514 Dale Evans | Apple Valley | 1980 | 01/06/2026 | 3 | 2 | 1,272 | 18,800 | $379,900 | $385,000 | $303 | 1.01 | 32 | 76 |
| Total: 5 · Average | 3.0 | 2.0 | 1,369.6 | 27,124 | $390,000 | $390,000 | $288.4 | — | 67.6 | ||||
| Median | 1,425 | $385,000 | $385,000 | ||||||||||
Market Analysis
List vs Sale $/SqFt
Sale Price Trend
Days on Market
Sale vs List Price
This analysis was generated automatically from MLS data. For an in-depth, human-reviewed valuation, contact Joseph Sardella at josephsardella@gmail.com.