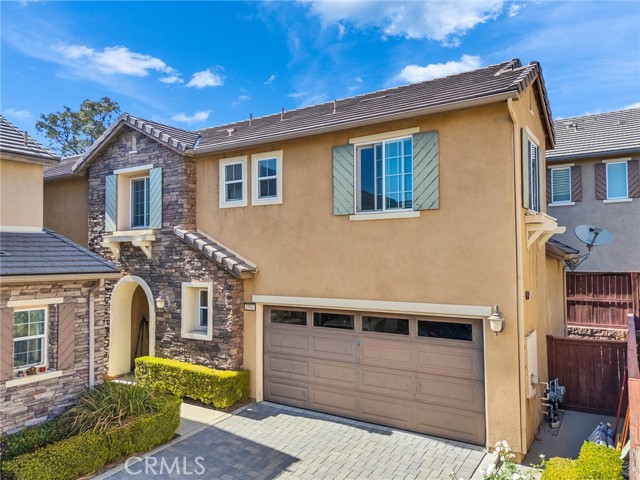
1593 Bayport, Upland, CA 91786
1593 Bayport, Upland, CA 91786
Property Description
Beautiful home in desirable Upland, located in the Upland Unified School District. Features 3 bedrooms, 2 bathrooms, and loft upstairs for added privacy. The spacious primary suite offers a comfortable retreat, complete with walk-in closet. Enjoy the convenience of an upstairs laundry room, making everyday living more efficient. Tile flooring on the first floor and wood flooring upstairs. Ideally located near shopping, dining, and major conveniences, this house offers both comfort and an excellent location.
Features & Amenities
Property Details
Mortgage Calculator
Current Rates
Comparative Market Analysis
Residential Tier · 5 active · 5 closed
Upland · Single Family Residence
Listed 11.2% below the median closed sale of $766,000. Price per sqft ($343) is a 21% discount to closed comps ($435). Closed comps sold at 101% of list — strong seller's market.
Price Position
Priced below the market — value advantage over the field.
Active Properties (5)
Active Comparables
| Address | City | Year | BD | BTH | SqFt | LotSz | LP/SqFt | LP | DIM | Score |
|---|---|---|---|---|---|---|---|---|---|---|
| 8826 Banyan Avenue | Montclair | 2018 | 3 | 3 | 1,863 | 2,668 | $375 | $698,000 | 45 | 80 |
| 1366 Branch | Upland | 1978 | 4 | 3 | 2,004 | 5,150 | $364 | $729,900 | 58 | 78 |
| 881 Pear Court | Upland | 2019 | 4 | 3 | 1,759 | 1,152 | $418 | $734,900 | 27 | 78 |
| 5014 Birch | Montclair | 2015 | 3 | 3 | 1,891 | 3,498 | $375 | $709,000 | 72 | 78 |
| 464 Middlebury Court | Claremont | 1999 | 3 | 3 | 1,509 | 2,318 | $490 | $740,000 | 70 | 77 |
| Total: 5 · Average | 3.4 | 3.0 | 1,805.2 | 2,957.2 | $404.4 | $722,360 | 54.4 | |||
| Median | 1,863 | $729,900 | ||||||||
Closed Properties (5)
Closed Comparables
| Address | City | Year | Date | BD | BTH | SqFt | LotSz | LP | SP | SP/SqFt | SP/LP | DIM | Score |
|---|---|---|---|---|---|---|---|---|---|---|---|---|---|
| 1371 Orchard Circle | Upland | 1978 | 06/26/2026 | 4 | 3 | 2,004 | 4,480 | $765,000 | $775,000 | $387 | 1.01 | 39 | 80 |
| 1580 Lakewood | Upland | 1977 | 06/24/2026 | 3 | 3 | 1,972 | 7,490 | $725,000 | $700,000 | $355 | 0.97 | 76 | 79 |
| 1565 Wedgewood | Upland | 1975 | 10/19/2026 | 3 | 2 | 1,753 | 7,503 | $708,000 | $766,000 | $437 | 1.08 | 33 | 76 |
| 1372 Branch Circle | Upland | 1978 | 08/19/2026 | 3 | 2 | 1,579 | 5,150 | $695,000 | $700,000 | $443 | 1.01 | 34 | 74 |
| 1267 Howard Street | Upland | 1963 | 06/15/2026 | 4 | 2 | 1,407 | 7,548 | $774,900 | $775,000 | $551 | 1.00 | 53 | 68 |
| Total: 5 · Average | 3.4 | 2.4 | 1,743 | 6,434.2 | $743,200 | $743,200 | $434.6 | — | 47 | ||||
| Median | 1,753 | $766,000 | $766,000 | ||||||||||
Market Analysis
List vs Sale $/SqFt
Sale Price Trend
Days on Market
Sale vs List Price
This analysis was generated automatically from MLS data. For an in-depth, human-reviewed valuation, contact Joseph Sardella at josephsardella@gmail.com.