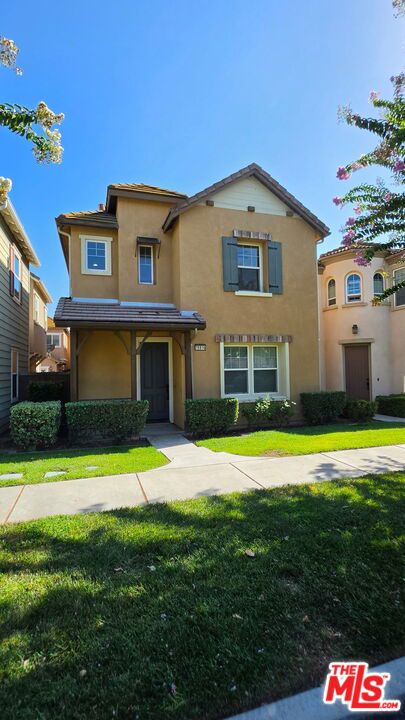
15916 Begonia Avenue, Chino, CA 91708
15916 Begonia Avenue, Chino, CA 91708
Property Description
Beautiful move-in ready three-bedroom with a loft, two-and-a-half bath, single-family home. Open floor plan, lots of natural light. Living room with a fireplace, kitchen with wood cabinets, granite counters, and an island with seating. Upstairs, the primary suite has a big walk-in closet, well-appointed en-suite with dual vanities, soaking tub, and separate shower. Two more bedrooms, second bath with dual sinks, laundry on the second floor. Big two-car garage.The community has pools, spas, clubhouse, fitness center, tennis courts, trails. Near shopping, dining, schools.
Features & Amenities
Property Details
Mortgage Calculator
Current Rates
Comparative Market Analysis
Residential Tier · 5 active · 5 closed
Chino · Condominium
Listed 6.9% above the median closed sale of $650,000. Price per sqft ($407) is a 11% premium to closed comps ($368). Closed comps sold at 101% of list — strong seller's market.
Price Position
Positioned above the market — commands a premium.
Active Properties (5)
Active Comparables
| Address | City | Year | BD | BTH | SqFt | LotSz | LP/SqFt | LP | DIM | Score |
|---|---|---|---|---|---|---|---|---|---|---|
| 16152 Paddock Avenue | Chino | 2023 | 3 | 3 | 1,664 | 1,000 | $406 | $675,000 | 4 | 86 |
| 7568 Spitfire | Chino | 2019 | 3 | 3 | 1,485 | 1,720 | $404 | $599,999 | 4 | 86 |
| 16111 Meadowhouse Ave | Chino | 2022 | 3 | 3 | 1,664 | 1,010 | $406 | $675,000 | 3 | 84 |
| 16218 Hollyhock Avenue | Chino | 2023 | 3 | 2 | 1,549 | 1,000 | $414 | $640,888 | 143 | 80 |
| 16083 Tanzinite Lane | Chino | 2023 | 3 | 3 | 2,096 | 1,000 | $346 | $724,999 | 59 | 78 |
| Total: 5 · Average | 3.0 | 2.8 | 1,691.6 | 1,146 | $395.2 | $663,177.2 | 42.6 | |||
| Median | 1,664 | $675,000 | ||||||||
Closed Properties (5)
Closed Comparables
| Address | City | Year | Date | BD | BTH | SqFt | LotSz | LP | SP | SP/SqFt | SP/LP | DIM | Score |
|---|---|---|---|---|---|---|---|---|---|---|---|---|---|
| 15931 Moonflower | Chino | 2007 | 01/27/2026 | 3 | 3 | 1,597 | 2,565 | $625,000 | $650,000 | $407 | 1.04 | 37 | 84 |
| 16004 Voyager | Chino | 2020 | 09/09/2026 | 4 | 4 | 2,150 | 1,795 | $739,000 | $739,000 | $344 | 1.00 | 154 | 78 |
| 16272 Meadowhouse | Chino | 2022 | 07/06/2026 | 3 | 4 | 2,080 | 1,000 | $705,000 | $700,000 | $337 | 0.99 | 142 | 74 |
| 16164 Paddock | Chino | 2023 | 05/20/2026 | 3 | 4 | 1,778 | 800 | $649,000 | $640,000 | $360 | 0.99 | 95 | 72 |
| 16210 Hollyhock Avenue | Chino | 2021 | 06/29/2026 | 3 | 2 | 1,550 | 1,000 | $599,000 | $610,000 | $394 | 1.02 | 60 | 70 |
| Total: 5 · Average | 3.2 | 3.4 | 1,831 | 1,432 | $667,800 | $667,800 | $368.4 | — | 97.6 | ||||
| Median | 1,778 | $650,000 | $650,000 | ||||||||||
Market Analysis
List vs Sale $/SqFt
Sale Price Trend
Days on Market
Sale vs List Price
This analysis was generated automatically from MLS data. For an in-depth, human-reviewed valuation, contact Joseph Sardella at josephsardella@gmail.com.