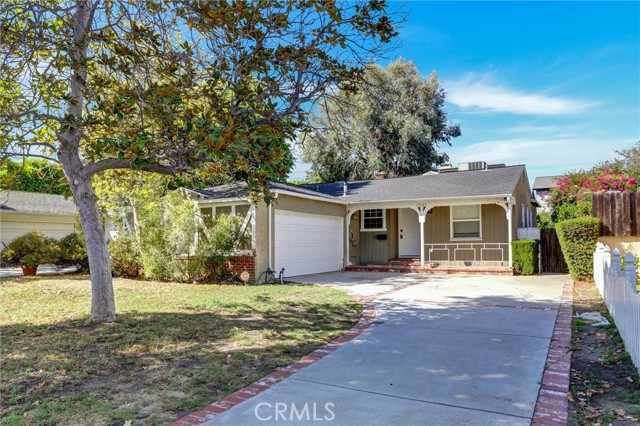
15123 Killion Street, Sherman Oaks, CA 91411
15123 Killion Street, Sherman Oaks, CA 91411
Property Description
Prime Sherman Oaks location in the highly sought-after Kester Elementary School District, situated on a quiet, tree-lined street. This light-filled home features an open floor plan with hardwood floors, recessed lighting, and abundant natural light throughout. The property offers flexible opportunities for both owner-occupants and investors. Excellent ADU potential for additional income or the opportunity to build a new custom home. Currently operating with a short-term rental permit. Property will delivered vacant
Features & Amenities
Property Details
Mortgage Calculator
Current Rates
Comparative Market Analysis
Affordable Tier · 5 active · 5 closed
Sherman Oaks · Single Family Residence
Listed in line with the median closed sale of $1,030,000. Price per sqft ($981) is a 28% premium to closed comps ($767). Closed comps sold at 100% of list — strong seller's market.
Price Position
Aligned with the market — fair pricing for the comps.
Active Properties (5)
Active Comparables
| Address | City | Year | BD | BTH | SqFt | LotSz | LP/SqFt | LP | DIM | Score |
|---|---|---|---|---|---|---|---|---|---|---|
| 14348 Collins Street | Sherman Oaks | 1949 | 3 | 1 | 1,214 | 6,327 | $896 | $1.09M | 116 | 85 |
| 5417 Bevis Avenue | Sherman Oaks | 1949 | 3 | 2 | 1,335 | 5,915 | $861 | $1.15M | 5 | 83 |
| 14738 Magnolia Boulevard | Sherman Oaks | 1940 | 2 | 1 | 1,000 | 6,504 | $1,000 | $1.00M | 37 | 82 |
| 14351 Martha | Van Nuys | 1950 | 2 | 1 | 1,015 | 6,327 | $936 | $950,000 | 101 | 82 |
| 5420 Columbus Avenue | Sherman Oaks | 1949 | 3 | 2 | 1,572 | 6,758 | $760 | $1.20M | 23 | 79 |
| Total: 5 · Average | 2.6 | 1.4 | 1,227.2 | 6,366.2 | $890.6 | $1.08M | 56.4 | |||
| Median | 1,214 | $1.09M | ||||||||
Closed Properties (5)
Closed Comparables
| Address | City | Year | Date | BD | BTH | SqFt | LotSz | LP | SP | SP/SqFt | SP/LP | DIM | Score |
|---|---|---|---|---|---|---|---|---|---|---|---|---|---|
| 5425 Halbrent | Sherman Oaks | 1953 | 04/22/2026 | 3 | 2 | 1,331 | 5,700 | $985,000 | $900,000 | $676 | 0.91 | 43 | 81 |
| 5740 Lemona Avenue | Sherman Oaks | 1951 | 05/11/2026 | 2 | 1 | 1,391 | 6,859 | $949,900 | $1.02M | $730 | 1.07 | 54 | 79 |
| 5728 Columbus Avenue Avenue | Sherman Oaks | — | 04/09/2026 | 3 | 2 | 1,254 | 6,751 | $1.10M | $1.09M | $869 | 0.99 | 28 | 79 |
| 5856 Halbrent Avenue | Sherman Oaks | 1947 | 10/07/2026 | 3 | 3 | 1,423 | 6,429 | $1.17M | $1.12M | $789 | 0.96 | 27 | 77 |
| 5715 Norwich Avenue | Van Nuys | 1950 | 01/21/2026 | 3 | 2 | 1,332 | 6,894 | $949,900 | $1.03M | $773 | 1.08 | 40 | 77 |
| Total: 5 · Average | 2.8 | 2.0 | 1,346.2 | 6,526.6 | $1.03M | $1.03M | $767.4 | — | 38.4 | ||||
| Median | 1,332 | $1.03M | $1.03M | ||||||||||
Market Analysis
List vs Sale $/SqFt
Sale Price Trend
Days on Market
Sale vs List Price
This analysis was generated automatically from MLS data. For an in-depth, human-reviewed valuation, contact Joseph Sardella at josephsardella@gmail.com.