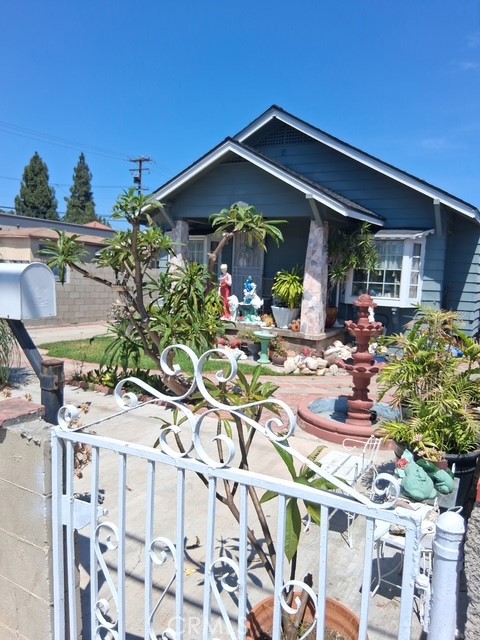
1 / 6
15122 San Jose Avenue, Paramount, CA 90723
$725K2bd · 1ba · 942 sqft
Lot 5,200 sqft•Single Family Residence•Active•59d on market•MLS# RS-26194527
15122 San Jose Avenue, Paramount, CA 90723
MLS# RS-26194527•Residential•Single Family Residence
Active59 days on market
$725,000
2
Beds
1
Baths
942
Sq Ft
5,200
Lot Sq Ft
1924
Year Built
None
View
Property Description
Lovely two bedroom home with all amenaties nearby,
Features & Amenities
FeeBuilt 1924
Property Details
Land Type
Fee
Year Built
1924
Property Type
Residential
Property Subtype
Single Family Residence
Parking Spaces
1
Garage Spaces
1
Cooling
None
View
None
City
Paramount
Zip Code
90723
County
Los Angeles
Mortgage Calculator
Current Rates
$
$
%
Monthly Payment
$3,665.99
Principal & Interest
Loan Amount
$580,000
Total Interest
$739,758
Total Payment Over 30 Years
$1,319,758
This calculator provides estimates only. Actual mortgage payments may include taxes, insurance, HOA fees, and PMI. Contact a lender for accurate quotes.
Comparative Market Analysis
Affordable Tier · 5 active · 5 closed
15122 San Jose Avenue, Paramount, CA 90723
Paramount · Single Family Residence
$725K
Affordable TierBeds
2
Baths
1
Sqft
942
Lot
5,200 sqft
Year
1924
$/Sqft
$770
Pool: No✓
View: None✓
Garage: 1-car✓
Listed 9.3% below the median closed sale of $799,000. Price per sqft ($770) is a 14% premium to closed comps ($675). Closed comps sold at 102% of list — strong seller's market.
Price Position
Priced below the market — value advantage over the field.
Price advantage
Subject listed at $725K· $770/sqft
Total list price
Closed comps
vs closed median $799K
−$74K (−9.3%)
Active comps
vs active median $675K
+$50K (+7.4%)
Price per sqft
Closed compsinsufficient comp data
Active comps
vs active avg $/sqft $742
+$28 (+3.8%)
Active Properties (5)
Active Comparables
| Address | City | Year | BD | BTH | SqFt | LotSz | LP/SqFt | LP | DIM | Score |
|---|---|---|---|---|---|---|---|---|---|---|
| 14517 White | Compton | 1940 | 2 | 1 | 731 | 6,662 | $847 | $619,000 | 4 | 82 |
| 1203 CASTLEGATE Avenue | Compton | 1950 | 2 | 1 | 1,010 | 5,232 | $644 | $650,000 | 73 | 80 |
| 270 Heath Lane | Long Beach | 1939 | 2 | 2 | 925 | 4,723 | $730 | $675,000 | 6 | 78 |
| 5426 Rayborn | Lynwood | 1940 | 3 | 2 | 1,076 | 6,682 | $697 | $750,000 | 25 | 78 |
| 705 Janice | Long Beach | 1942 | 2 | 1 | 884 | 4,756 | $791 | $699,000 | 13 | 76 |
| Total: 5 · Average | 2.2 | 1.4 | 925.2 | 5,611 | $741.8 | $678,600 | 24.2 | |||
| Median | 925 | $675,000 | ||||||||
Closed Properties (5)
Closed Comparables
| Address | City | Year | Date | BD | BTH | SqFt | LotSz | LP | SP | SP/SqFt | SP/LP | DIM | Score |
|---|---|---|---|---|---|---|---|---|---|---|---|---|---|
| 14912 Gibson | Compton | 1931 | 06/30/2026 | 2 | 1 | 966 | 5,073 | $650,000 | $650,000 | $673 | 1.00 | 57 | 90 |
| 6552 San Juan Street | Paramount | 1937 | 06/01/2026 | 2 | 1 | 1,136 | 6,099 | $705,000 | $740,000 | $651 | 1.05 | 39 | 85 |
| 7047 San Marcus | Paramount | 1928 | 07/08/2026 | 3 | 2 | 1,284 | 6,366 | $795,000 | $802,000 | $625 | 1.01 | 62 | 77 |
| 6610 San Carlos Street | Paramount | 1953 | 06/30/2026 | 3 | 2 | 1,052 | 6,406 | $788,888 | $799,000 | $760 | 1.01 | 51 | 76 |
| 6556 San Vincente | Paramount | 1947 | 06/23/2026 | 3 | 2 | 1,200 | 6,086 | $795,000 | $800,000 | $667 | 1.01 | 124 | 75 |
| Total: 5 · Average | 2.6 | 1.6 | 1,127.6 | 6,006 | $758,200 | $758,200 | $675.2 | — | 66.6 | ||||
| Median | 1,136 | $799,000 | $799,000 | ||||||||||
Market Analysis
List vs Sale $/SqFt
Sale Price Trend
Days on Market
Sale vs List Price
AI-generated CMA
This analysis was generated automatically from MLS data. For an in-depth, human-reviewed valuation, contact Joseph Sardella at josephsardella@gmail.com.