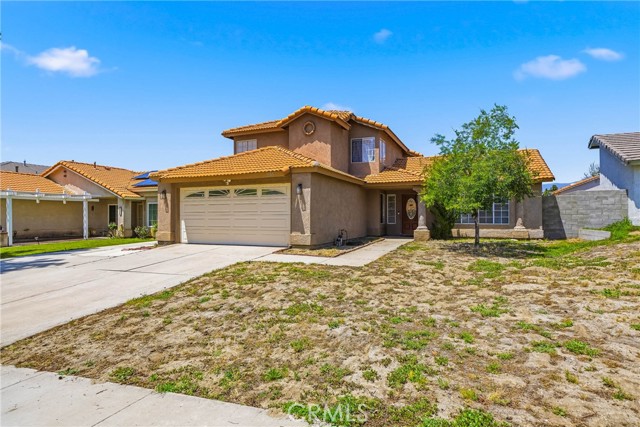
1505 Canterbury, Redlands, CA 92374
1505 Canterbury, Redlands, CA 92374
Property Description
Spacious and versatile, this five-bedroom, four-bath home offers an ideal combination of comfort, modern upgrades, and flexible living space. A private downstairs suite with its own bathroom is perfect for extended family, guests, or a home office, with potential for conversion into a junior ADU—subject to local requirements and approvals. The home features fresh interior paint, updated appliances, a newer electrical panel, and a Tesla charging station. Situated on a generously sized lot, the property provides plenty of room to relax, entertain, and make it your own. Conveniently located near schools, shopping centers, dining, and everyday amenities, this home offers exceptional space, flexibility, and value.
Features & Amenities
Property Details
Mortgage Calculator
Current Rates
Comparative Market Analysis
Residential Tier · 5 active · 5 closed
Redlands · Single Family Residence
Listed 5.8% below the median closed sale of $680,000. Price per sqft ($268) is a 15% discount to closed comps ($314).
Price Position
Priced below the market — value advantage over the field.
Active Properties (5)
Active Comparables
| Address | City | Year | BD | BTH | SqFt | LotSz | LP/SqFt | LP | DIM | Score |
|---|---|---|---|---|---|---|---|---|---|---|
| 2037 Grapefruit Street | Redlands | 2026 | 5 | 3 | 2,418 | 3,500 | $301 | $729,000 | 72 | 80 |
| 2038 Grapefruit Street | Redlands | 2026 | 4 | 3 | 2,168 | 3,500 | $325 | $704,000 | 74 | 77 |
| 1655 Mardi Gras | Redlands | 2022 | 4 | 3 | 2,590 | 4,690 | $278 | $719,000 | 131 | 75 |
| 1664 Camellia Lane | Redlands | 2022 | 4 | 3 | 2,010 | 4,165 | $323 | $649,999 | 58 | 73 |
| 1539 Robyn | Redlands | 1979 | 4 | 2 | 1,308 | 10,150 | $457 | $597,999 | 74 | 73 |
| Total: 5 · Average | 4.2 | 2.8 | 2,098.8 | 5,201 | $336.8 | $679,999.6 | 81.8 | |||
| Median | 2,168 | $704,000 | ||||||||
Closed Properties (5)
Closed Comparables
| Address | City | Year | Date | BD | BTH | SqFt | LotSz | LP | SP | SP/SqFt | SP/LP | DIM | Score |
|---|---|---|---|---|---|---|---|---|---|---|---|---|---|
| 1845 Furlow Drive | Redlands | 2006 | 11/19/2025 | 4 | 2 | 2,427 | 7,329 | $680,000 | $680,000 | $280 | 1.00 | 63 | 81 |
| 1704 Camellia Lane | Redlands | 2022 | 06/03/2026 | 4 | 3 | 2,253 | 3,375 | $720,000 | $720,000 | $320 | 1.00 | 51 | 79 |
| 1450 Washington Street | Redlands | 1945 | 08/31/2026 | 4 | 2 | 1,812 | 6,223 | $549,000 | $549,000 | $303 | 1.00 | 122 | 72 |
| 1760 Gold Medal Lane | Redlands | 2023 | 02/05/2026 | 4 | 3 | 2,253 | 3,374 | $699,900 | $695,000 | $308 | 0.99 | 161 | 70 |
| 1679 Camellia | Redlands | 2022 | 04/30/2026 | 4 | 3 | 1,864 | 3,518 | $665,000 | $665,000 | $357 | 1.00 | 37 | 69 |
| Total: 5 · Average | 4.0 | 2.6 | 2,121.8 | 4,763.8 | $661,800 | $661,800 | $313.6 | — | 86.8 | ||||
| Median | 2,253 | $680,000 | $680,000 | ||||||||||
Market Analysis
List vs Sale $/SqFt
Sale Price Trend
Days on Market
Sale vs List Price
This analysis was generated automatically from MLS data. For an in-depth, human-reviewed valuation, contact Joseph Sardella at josephsardella@gmail.com.