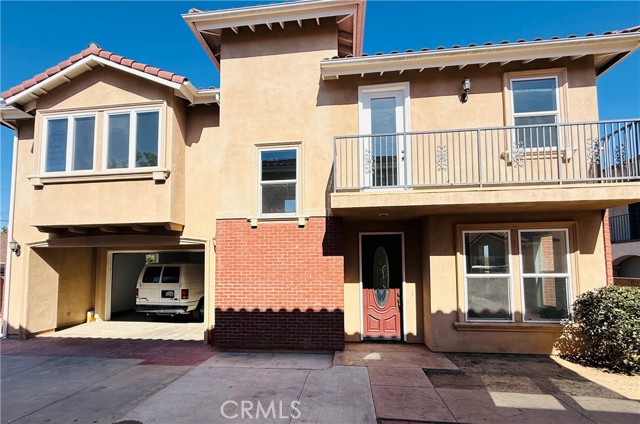
1500 Palm Avenue, E, San Gabriel, CA 91776
1500 Palm Avenue, E, San Gabriel, CA 91776
Property Description
A quite and private end-unit PUD with plenty of privacy and its own peaceful backyard in San Gabriel City. Fresh paint throughout the entire house and new Luxury Vinyl flooring in the living room and all the bedrooms. 9-foot ceilings throughout the home. Open and spacious Living and Dining room, comfortable kitchen and a full bath on the main floor. Kitchen with tile floor, quartz counter top, 5 burner stove and power exhaust fan. Upstairs features a spacious master suite, two addition well-sized bedrooms and a shared full bathroom. Conveniently located in a highly desirable area, easy excess to freeway 10 and 710, walking distance to Valley Blvd, variety of supermarkets, grocery stores and restaurants. Attached 2 cars garage.
Features & Amenities
Property Details
Mortgage Calculator
Current Rates
Comparative Market Analysis
Residential Tier · 4 active · 5 closed
San Gabriel · Townhouse
Listed 10.3% above the median closed sale of $988,000.
Price Position
Positioned above the market — commands a premium.
Active Properties (4)
Active Comparables
| Address | City | Year | BD | BTH | SqFt | LotSz | LP/SqFt | LP | DIM | Score |
|---|---|---|---|---|---|---|---|---|---|---|
| 220 Mission | San Gabriel | 2026 | 3 | 3 | 1,972 | 7,576 | $634 | $1.25M | 18 | 74 |
| 8615 Mission Villa dr | Rosemead | 2024 | 3 | 3 | 1,915 | 2,508 | $585 | $1.12M | 129 | 70 |
| 426 Avondale Avenue | Monterey Park | 1996 | 4 | 3 | 1,914 | 16,912 | $496 | $950,000 | 33 | 66 |
| 468 Alhambra Avenue | Monterey Park | 2007 | 4 | 3 | 2,142 | 61,326 | $555 | $1.19M | 51 | 61 |
| Total: 4 · Average | 3.5 | 3.0 | 1,985.75 | 22,080.5 | $567.5 | $1.13M | 57.75 | |||
| Median | 1,972 | $1.19M | ||||||||
Closed Properties (5)
Closed Comparables
| Address | City | Year | Date | BD | BTH | SqFt | LotSz | LP | SP | SP/SqFt | SP/LP | DIM | Score |
|---|---|---|---|---|---|---|---|---|---|---|---|---|---|
| 15 Chapel Avenue | Alhambra | 2024 | 08/13/2026 | 4 | 4 | 1,981 | 19,296 | $1.29M | $1.14M | $573 | 0.88 | 94 | 74 |
| 206 Moore Avenue | Monterey Park | 2020 | 08/18/2026 | 3 | 3 | 1,710 | 15,273 | $980,000 | $950,000 | $556 | 0.97 | 69 | 73 |
| 309 Almansor Street | Alhambra | 2001 | 05/27/2026 | 4 | 2 | 1,894 | 23,984 | $958,000 | $955,000 | $504 | 1.00 | 43 | 69 |
| 5067 Sereno Dr | Temple City | 2009 | 08/14/2026 | 4 | 3 | 1,585 | 27,589 | $939,000 | $988,000 | $623 | 1.05 | 22 | 68 |
| 8739 Sienna Lane | San Gabriel | 2020 | 12/23/2025 | 4 | 3 | 2,196 | 0 | $1.17M | $1.16M | $528 | 1.00 | 82 | 68 |
| Total: 5 · Average | 3.8 | 3.0 | 1,873.2 | 21,535.5 | $1.04M | $1.04M | $556.8 | — | 62 | ||||
| Median | 1,894 | $988,000 | $988,000 | ||||||||||
Market Analysis
List vs Sale $/SqFt
Sale Price Trend
Days on Market
Sale vs List Price
This analysis was generated automatically from MLS data. For an in-depth, human-reviewed valuation, contact Joseph Sardella at josephsardella@gmail.com.