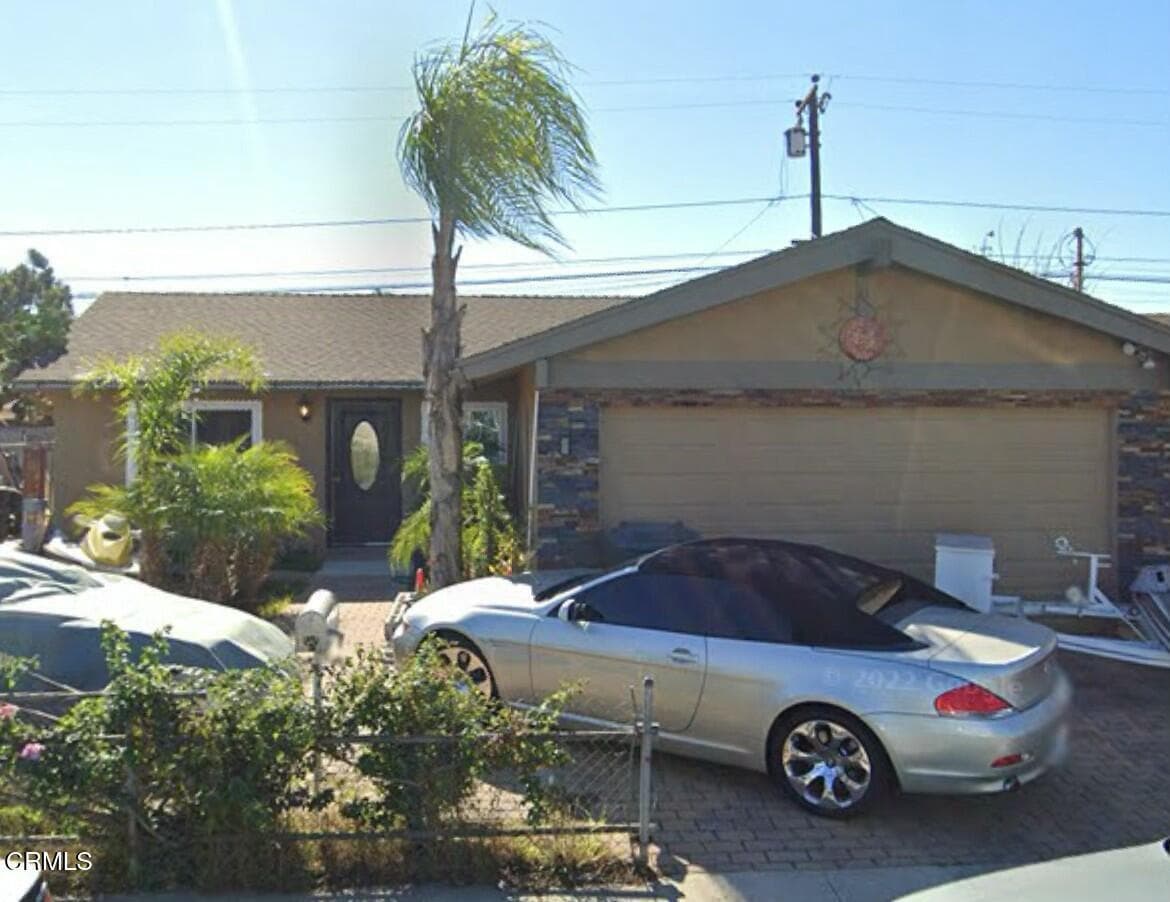
1 / 7
1440 Morris Street, Oxnard, CA 93030
$750K4bd · 1ba · 1,080 sqft
Lot 3,920 sqft•Single Family Residence•Active•165d on market•MLS# V1-36546
1440 Morris Street, Oxnard, CA 93030
MLS# V1-36546•Residential•Single Family Residence
Active165 days on market
$750,000
4
Beds
1
Baths
1,080
Sq Ft
3,920
Lot Sq Ft
1964
Year Built
None
View
Property Description
Cozy home with upgraded kitchen cabinets, granite counter tops well crafted entertainment center with electric decor fireplace. This home is a must see with attractive upgrades throughout. Home to be delivered vacant.
Features & Amenities
FeeBuilt 1964
Property Details
Land Type
Fee
Year Built
1964
Property Type
Residential
Property Subtype
Single Family Residence
Garage Spaces
2
Heating
Floor Furnace
Cooling
None
View
None
Roof
Shingle
City
Oxnard
Zip Code
93030
County
Ventura
Mortgage Calculator
Current Rates
$
$
%
Monthly Payment
$3,792.41
Principal & Interest
Loan Amount
$600,000
Total Interest
$765,267
Total Payment Over 30 Years
$1,365,267
This calculator provides estimates only. Actual mortgage payments may include taxes, insurance, HOA fees, and PMI. Contact a lender for accurate quotes.
Comparative Market Analysis
Affordable Tier · 5 active · 5 closed
1440 Morris Street, Oxnard, CA 93030
Oxnard · Single Family Residence
$750K
Affordable TierBeds
4
Baths
1
Sqft
1,080
Lot
3,920 sqft
Year
1964
$/Sqft
$694
Pool: No✓
Spa: No✓
View: None✓
Garage: 2-car✓
Listed 5.6% above the median closed sale of $710,000. Price per sqft ($694) is a 20% premium to closed comps ($578). Closed comps sold at 101% of list — strong seller's market.
Price Position
Positioned above the market — commands a premium.
Premium
Subject listed at $750K· $694/sqft
Total list price
Closed comps
vs closed median $710K
+$40K (+5.6%)
Active comps
vs active median $815K
−$65K (−8.0%)
Price per sqft
Closed compsinsufficient comp data
Active comps
vs active avg $/sqft $635
+$59 (+9.3%)
Active Properties (5)
Active Comparables
| Address | City | Year | BD | BTH | SqFt | LotSz | LP/SqFt | LP | DIM | Score |
|---|---|---|---|---|---|---|---|---|---|---|
| 2044 San Jose Street | Oxnard | 1963 | 3 | 1 | 1,023 | 4,379 | $683 | $699,000 | 6 | 90 |
| 743 Paseo Ortega | Oxnard | 2000 | 3 | 2 | 1,255 | 2,613 | $594 | $745,000 | 16 | 73 |
| 1135 2nd Street | Oxnard | 2025 | 3 | 2 | 1,201 | 4,441 | $679 | $815,000 | 19 | 71 |
| 1711 Florentina Drive | Oxnard | 1997 | 4 | 3 | 1,560 | 3,484 | $540 | $843,000 | 124 | 70 |
| 1125 2nd Street | Oxnard | 2025 | 3 | 2 | 1,201 | 4,441 | $679 | $815,000 | 72 | 70 |
| Total: 5 · Average | 3.2 | 2.0 | 1,248 | 3,871.6 | $635 | $783,400 | 47.4 | |||
| Median | 1,201 | $815,000 | ||||||||
Closed Properties (5)
Closed Comparables
| Address | City | Year | Date | BD | BTH | SqFt | LotSz | LP | SP | SP/SqFt | SP/LP | DIM | Score |
|---|---|---|---|---|---|---|---|---|---|---|---|---|---|
| 1501 Morris Street | Oxnard | 1964 | 01/14/2026 | 3 | 1 | 936 | 3,920 | $650,000 | $650,000 | $694 | 1.00 | 71 | 86 |
| 164 Harding Avenue | Oxnard | 1950 | 05/21/2026 | 3 | 1 | 1,008 | 3,920 | $639,000 | $642,500 | $637 | 1.00 | 38 | 85 |
| 221 Vegas Drive | Oxnard | 1969 | 10/21/2026 | 4 | 2 | 1,260 | 4,791 | $699,000 | $710,000 | $563 | 1.02 | 41 | 84 |
| 226 Mckinley Avenue | Oxnard | 1945 | 10/21/2026 | 3 | 2 | 1,600 | 4,800 | $749,999 | $755,000 | $472 | 1.01 | 57 | 70 |
| 565 Rosalinda Drive | Oxnard | 1998 | 04/07/2026 | 3 | 2 | 1,605 | 5,662 | $830,000 | $845,000 | $526 | 1.02 | 41 | 61 |
| Total: 5 · Average | 3.2 | 1.6 | 1,281.8 | 4,618.6 | $720,500 | $720,500 | $578.4 | — | 49.6 | ||||
| Median | 1,260 | $710,000 | $710,000 | ||||||||||
Market Analysis
List vs Sale $/SqFt
Sale Price Trend
Days on Market
Sale vs List Price
AI-generated CMA
This analysis was generated automatically from MLS data. For an in-depth, human-reviewed valuation, contact Joseph Sardella at josephsardella@gmail.com.