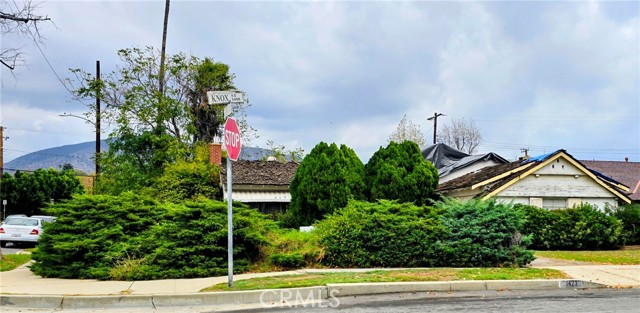
1423 Knox, San Fernando, CA 91340
1423 Knox, San Fernando, CA 91340
Property Description
This is the house you have all been waiting for. She is ready for a transformation. In a lovely residential area of the city of San Fernando. Featuring three bedrooms and two bathrooms, it's a corner property with a semi-circular driveway and oh yes, it has a pool and a double attached garage.
Features & Amenities
Property Details
Mortgage Calculator
Current Rates
Comparative Market Analysis
Residential Tier · 5 active · 5 closed
San Fernando · Single Family Residence
Listed 10.3% below the median closed sale of $780,000. Price per sqft ($439) is a 26% discount to closed comps ($595). Closed comps sold at 103% of list — strong seller's market.
Price Position
Priced below the market — value advantage over the field.
Active Properties (5)
Active Comparables
| Address | City | Year | BD | BTH | SqFt | LotSz | LP/SqFt | LP | DIM | Score |
|---|---|---|---|---|---|---|---|---|---|---|
| 11924 Chadron Avenue | San Fernando | 1959 | 3 | 2 | 1,284 | 5,748 | $623 | $800,000 | 111 | 79 |
| 13584 Kismet | Sylmar | 1955 | 3 | 2 | 1,760 | 5,590 | $440 | $775,000 | 20 | 79 |
| 11848 Chadron | Pacoima | 1957 | 4 | 3 | 1,435 | 6,474 | $540 | $775,000 | 54 | 77 |
| 13658 Garrick Avenue | Sylmar | 1955 | 3 | 2 | 1,190 | 7,502 | $630 | $749,950 | 19 | 77 |
| 12937 Del Sur Street | San Fernando | 1957 | 4 | 2 | 1,150 | 6,042 | $635 | $730,000 | 38 | 76 |
| Total: 5 · Average | 3.4 | 2.2 | 1,363.8 | 6,271.2 | $573.6 | $765,990 | 48.4 | |||
| Median | 1,284 | $775,000 | ||||||||
Closed Properties (5)
Closed Comparables
| Address | City | Year | Date | BD | BTH | SqFt | LotSz | LP | SP | SP/SqFt | SP/LP | DIM | Score |
|---|---|---|---|---|---|---|---|---|---|---|---|---|---|
| 1601 Fermoore | San Fernando | 1948 | 05/13/2026 | 3 | 2 | 1,136 | 7,732 | $749,900 | $775,000 | $682 | 1.03 | 57 | 87 |
| 13176 Foothill | Sylmar | 1954 | 10/26/2026 | 4 | 3 | 1,782 | 6,752 | $799,900 | $800,000 | $449 | 1.00 | 103 | 86 |
| 1011 Shadow | San Fernando | 1971 | 10/13/2026 | 4 | 2 | 1,569 | 5,308 | $730,000 | $735,000 | $468 | 1.01 | 181 | 86 |
| 12476 Adelphia Avenue | San Fernando | 1948 | 06/24/2026 | 3 | 2 | 1,144 | 7,001 | $699,950 | $780,000 | $682 | 1.11 | 104 | 83 |
| 12470 Adelphia | San Fernando | 1944 | 07/30/2026 | 3 | 1 | 1,129 | 7,001 | $774,900 | $785,000 | $695 | 1.01 | 61 | 81 |
| Total: 5 · Average | 3.4 | 2.0 | 1,352 | 6,758.8 | $775,000 | $775,000 | $595.2 | — | 101.2 | ||||
| Median | 1,144 | $780,000 | $780,000 | ||||||||||
Market Analysis
List vs Sale $/SqFt
Sale Price Trend
Days on Market
Sale vs List Price
This analysis was generated automatically from MLS data. For an in-depth, human-reviewed valuation, contact Joseph Sardella at josephsardella@gmail.com.