1 / 1
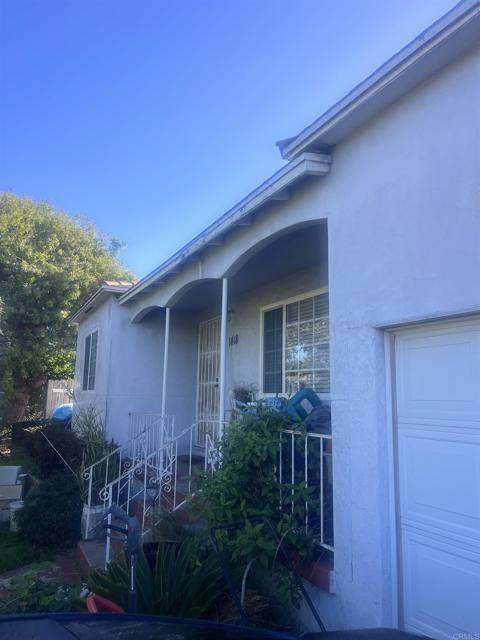
1418 East 17Th Street, National City, CA 91950
$700K2bd · 1ba · 990 sqft
Lot 0 sqft•Single Family Residence•Active•7d on market•MLS# 8P-2608006
1418 East 17Th Street, National City, CA 91950
MLS# 8P-2608006•Residential•Single Family Residence
Active7 days on market
$700,000
2
Beds
1
Baths
990
Sq Ft
0
Lot Sq Ft
1953
Year Built
None
View
Property Description
Great Opportunity for Investors or first Time buyers, bring your brush and put your personal touches in this property, 2 Bedrooms 1 Bath, centrally located in east National City, Close to Chopping Center and Freeways, Ample back yard, enough to build an ADU. com and check it out before is gone!!
Features & Amenities
FeeBuilt 1953
Property Details
Land Type
Fee
Year Built
1953
Property Type
Residential
Property Subtype
Single Family Residence
Parking Spaces
1
Garage Spaces
1
Cooling
None
View
None
City
National City
Zip Code
91950
County
San Diego
Mortgage Calculator
Current Rates
$
$
%
Monthly Payment
$3,539.58
Principal & Interest
Loan Amount
$560,000
Total Interest
$714,249
Total Payment Over 30 Years
$1,274,249
This calculator provides estimates only. Actual mortgage payments may include taxes, insurance, HOA fees, and PMI. Contact a lender for accurate quotes.
Comparative Market Analysis
Affordable Tier · 5 active · 5 closed
1418 East 17Th Street, National City, CA 91950
National City · Single Family Residence
$700K
Affordable TierBeds
2
Baths
1
Sqft
990
Lot
6,534 sqft
Year
1953
$/Sqft
$707
Pool: No✓
Spa: No✓
View: None✓
Garage: 1-car✓
Listed 4.8% below the median closed sale of $735,000. Price per sqft ($707) is a 16% premium to closed comps ($608).
Price Position
Aligned with the market — fair pricing for the comps.
At market
Subject listed at $700K· $707/sqft
Total list price
Closed comps
vs closed median $735K
−$35K (−4.8%)
Active comps
vs active median $749K
−$49K (−6.5%)
Price per sqft
Closed compsinsufficient comp data
Active comps
vs active avg $/sqft $658
+$49 (+7.4%)
Active Properties (5)
Active Comparables
| Address | City | Year | BD | BTH | SqFt | LotSz | LP/SqFt | LP | DIM | Score |
|---|---|---|---|---|---|---|---|---|---|---|
| 1340 8th Street | National City | 1946 | 2 | 1 | 1,072 | 8,891 | $676 | $725,000 | 87 | 89 |
| 1810 Granger Avenue | National City | 1950 | 4 | 2 | 1,032 | 5,662 | $751 | $775,000 | 16 | 81 |
| 140 Palm Ave | National City | 1923 | 2 | 1 | 796 | 6,002 | $878 | $699,000 | 62 | 77 |
| 2325 14Th Street | National City | 1977 | 3 | 2 | 1,514 | 6,534 | $495 | $749,000 | 5 | 69 |
| 2121 4Th Street | National City | 1960 | 3 | 2 | 1,528 | 5,227 | $491 | $749,999 | 128 | 67 |
| Total: 5 · Average | 2.8 | 1.6 | 1,188.4 | 6,463.2 | $658.2 | $739,599.8 | 59.6 | |||
| Median | 1,072 | $749,000 | ||||||||
Closed Properties (5)
Closed Comparables
| Address | City | Year | Date | BD | BTH | SqFt | LotSz | LP | SP | SP/SqFt | SP/LP | DIM | Score |
|---|---|---|---|---|---|---|---|---|---|---|---|---|---|
| 1432 20Th Street | National City | 1940 | 08/14/2026 | 3 | 1 | 936 | 5,000 | $720,000 | $735,000 | $785 | 1.02 | 49 | 87 |
| 1809 Grove Street | National City | 1937 | 06/15/2026 | 2 | 1 | 768 | 9,759 | $610,000 | $610,000 | $794 | 1.00 | 45 | 82 |
| 1917 Palm | National City | 1936 | 07/10/2026 | 3 | 2 | 1,373 | 4,356 | $765,000 | $775,000 | $564 | 1.01 | 39 | 76 |
| 1843 16Th Street | National City | 1928 | 08/31/2026 | 4 | 2 | 1,641 | 7,405 | $775,000 | $775,000 | $472 | 1.00 | 25 | 66 |
| 1506 G Avenue | National City | 1940 | 12/30/2025 | 4 | 2 | 1,632 | 5,592 | $749,000 | $695,000 | $426 | 0.93 | 26 | 55 |
| Total: 5 · Average | 3.2 | 1.6 | 1,270 | 6,422.4 | $718,000 | $718,000 | $608.2 | — | 36.8 | ||||
| Median | 1,373 | $735,000 | $735,000 | ||||||||||
Market Analysis
List vs Sale $/SqFt
Sale Price Trend
Days on Market
Sale vs List Price
AI-generated CMA
This analysis was generated automatically from MLS data. For an in-depth, human-reviewed valuation, contact Joseph Sardella at josephsardella@gmail.com.