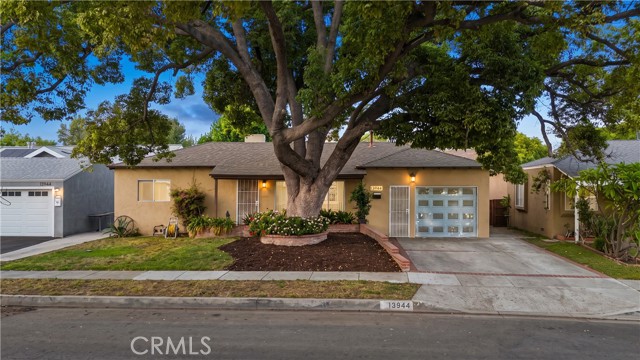
13944 Brightwell Avenue, Paramount, CA 90723
13944 Brightwell Avenue, Paramount, CA 90723
Property Description
Welcome to the beautiful city of Paramount! This 4-bedroom, 2-bath home offers tons of potential and is ready for your personal touch. Featuring over 1,400 square feet of living space, a spacious lot of over 5,400 square feet, and an attached 2-car garage, this property provides plenty of room to make it your own. Bring your imagination and create the home you’ve been dreaming of. Located in a quiet and peaceful Paramount neighborhood with convenient access to nearby shopping, dining, schools, and major freeways. Don’t miss this opportunity!
Features & Amenities
Property Details
Mortgage Calculator
Current Rates
Comparative Market Analysis
Affordable Tier · 5 active · 5 closed
Paramount · Single Family Residence
Listed 8.6% below the median closed sale of $799,000. Price per sqft ($512) is a 14% discount to closed comps ($594). Closed comps sold at 101% of list — strong seller's market.
Price Position
Priced below the market — value advantage over the field.
Active Properties (5)
Active Comparables
| Address | City | Year | BD | BTH | SqFt | LotSz | LP/SqFt | LP | DIM | Score |
|---|---|---|---|---|---|---|---|---|---|---|
| 6057 Lincoln | South Gate | 1942 | 3 | 2 | 920 | 5,500 | $734 | $675,000 | 8 | 84 |
| 5516 Rayborn Street | Lynwood | 1940 | 3 | 2 | 1,278 | 6,741 | $547 | $699,000 | 8 | 84 |
| 14523 Coke Avenue | Paramount | 1956 | 3 | 2 | 1,240 | 4,945 | $641 | $795,000 | 4 | 80 |
| 8243 Lankin | Downey | 1942 | 3 | 2 | 1,330 | 6,689 | $628 | $835,000 | 4 | 80 |
| 5426 Rayborn | Lynwood | 1940 | 3 | 2 | 1,076 | 6,682 | $697 | $750,000 | 25 | 79 |
| Total: 5 · Average | 3.0 | 2.0 | 1,168.8 | 6,111.4 | $649.4 | $750,800 | 9.8 | |||
| Median | 1,240 | $750,000 | ||||||||
Closed Properties (5)
Closed Comparables
| Address | City | Year | Date | BD | BTH | SqFt | LotSz | LP | SP | SP/SqFt | SP/LP | DIM | Score |
|---|---|---|---|---|---|---|---|---|---|---|---|---|---|
| 5968 Gardendale | South Gate | 1942 | 06/15/2026 | 4 | 2 | 1,400 | 5,590 | $799,999 | $800,000 | $571 | 1.00 | 63 | 88 |
| 11702 Utah | South Gate | 1941 | 06/29/2026 | 3 | 2 | 1,313 | 6,480 | $755,000 | $767,000 | $584 | 1.02 | 56 | 85 |
| 6019 Florence Avenue | South Gate | 1944 | 02/11/2026 | 3 | 2 | 1,313 | 6,482 | $799,000 | $799,000 | $609 | 1.00 | 154 | 84 |
| 13478 Fanshaw Avenue | Paramount | 1949 | 07/01/2026 | 3 | 2 | 1,281 | 6,669 | $725,000 | $745,000 | $582 | 1.03 | 74 | 83 |
| 7047 San Marcus | Paramount | 1928 | 07/08/2026 | 3 | 2 | 1,284 | 6,366 | $795,000 | $802,000 | $625 | 1.01 | 62 | 82 |
| Total: 5 · Average | 3.2 | 2.0 | 1,318.2 | 6,317.4 | $782,600 | $782,600 | $594.2 | — | 81.8 | ||||
| Median | 1,313 | $799,000 | $799,000 | ||||||||||
Market Analysis
List vs Sale $/SqFt
Sale Price Trend
Days on Market
Sale vs List Price
This analysis was generated automatically from MLS data. For an in-depth, human-reviewed valuation, contact Joseph Sardella at josephsardella@gmail.com.