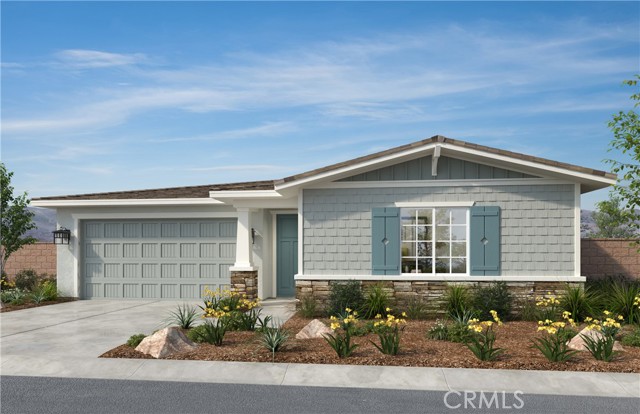
1381 Jack Rabbit Court, Banning, CA 92220
1381 Jack Rabbit Court, Banning, CA 92220
Property Description
Welcome to this stunning traditional single story home Featuring beautiful white cabinets, granite kitchen counter tops, and stainless whirlpool appliances. Primary bathroom includes a walk-in shower and walk-in closet. Enjoy your spacious living space with Walk in pantry and 2/3 secondary bedrooms have walk in closet. The community is located close to 10fwy. Homeowners can also enjoy nearby recreation and shopping like Cabazon Outlets and Casino Morongo a short distance Photo is a rendering of the model! you can either purchase or lease the solar
Features & Amenities
Property Details
Mortgage Calculator
Current Rates
Comparative Market Analysis
Residential Tier · 5 active · 5 closed
Banning · Single Family Residence
Listed in line with the median closed sale of $525,990. Closed comps sold at 101% of list — strong seller's market. Expect a longer timeline — comps averaged 127 days on market.
Price Position
Aligned with the market — fair pricing for the comps.
Active Properties (5)
Active Comparables
| Address | City | Year | BD | BTH | SqFt | LotSz | LP/SqFt | LP | DIM | Score |
|---|---|---|---|---|---|---|---|---|---|---|
| 1387 Wild Cat Court | Banning | 2026 | 4 | 2 | 2,097 | 8,210 | $249 | $521,990 | 89 | 95 |
| 1035 Hoffer Street | Banning | 1963 | 3 | 2 | 1,405 | 6,970 | $349 | $490,000 | 194 | 73 |
| 1424 Wyte Way | Banning | 1980 | 3 | 2 | 1,216 | 19,602 | $426 | $518,000 | 16 | 71 |
| 604 Pendleton Road | Banning | 1960 | 4 | 2 | 1,512 | 8,276 | $323 | $489,000 | 17 | 70 |
| 1193 King | Banning | 1965 | 5 | 3 | 3,167 | 7,405 | $158 | $499,900 | 283 | 65 |
| Total: 5 · Average | 3.8 | 2.2 | 1,879.4 | 10,092.6 | $301 | $503,778 | 119.8 | |||
| Median | 1,512 | $499,900 | ||||||||
Closed Properties (5)
Closed Comparables
| Address | City | Year | Date | BD | BTH | SqFt | LotSz | LP | SP | SP/SqFt | SP/LP | DIM | Score |
|---|---|---|---|---|---|---|---|---|---|---|---|---|---|
| 1320 Jack Rabbit Court | Banning | 2026 | 07/31/2026 | 4 | 2 | 1,851 | 7,880 | $524,711 | $524,711 | $283 | 1.00 | 47 | 93 |
| 1254 Butterfly Way | Banning | 2025 | 11/17/2025 | 4 | 2 | 2,397 | 7,000 | $535,990 | $535,990 | $224 | 1.00 | 142 | 87 |
| 1356 Eagle Drive | Banning | 2025 | 05/28/2026 | 3 | 2 | 1,851 | 8,651 | $481,990 | $500,856 | $271 | 1.04 | 246 | 83 |
| 1217 Butterfly Way | Banning | 2025 | 11/17/2025 | 5 | 3 | 2,533 | 7,134 | $530,990 | $525,990 | $208 | 0.99 | 142 | 82 |
| 1098 Silver Star | Banning | 1998 | 05/22/2026 | 3 | 3 | 1,793 | 9,583 | $530,000 | $533,000 | $297 | 1.01 | 57 | 77 |
| Total: 5 · Average | 3.8 | 2.4 | 2,085 | 8,049.6 | $524,109.4 | $524,109.4 | $256.6 | — | 126.8 | ||||
| Median | 1,851 | $525,990 | $525,990 | ||||||||||
Market Analysis
List vs Sale $/SqFt
Sale Price Trend
Days on Market
Sale vs List Price
This analysis was generated automatically from MLS data. For an in-depth, human-reviewed valuation, contact Joseph Sardella at josephsardella@gmail.com.