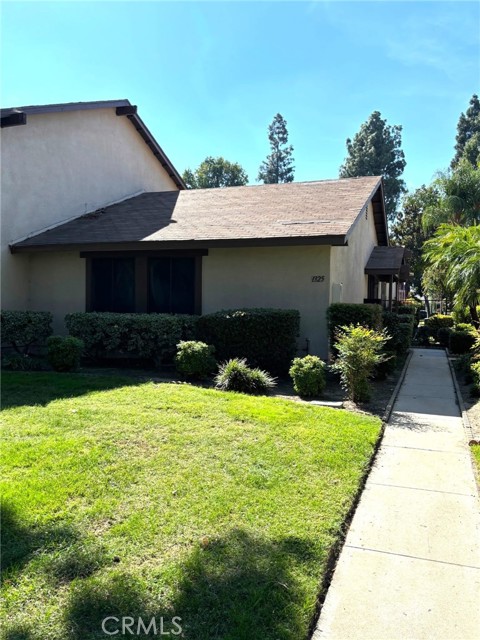
1325 North San Diego, Ontario, CA 91764
1325 North San Diego, Ontario, CA 91764
Property Description
Come see this charming single-story condo nestled in a tranquil cul-de-sac in the heart of Ontario . Perfectly balancing comfort and convenience, this residence offers two generously sized bedrooms and one elegantly updated bathroom. The open-concept living area flows effortlessly into the kitchen, where you can enjoy meals with friends & family. This home has a 2-car detached garage providing secure parking and additional storage options. Residents will delight in exclusive access to a private association pool and BBQ area—ideal for those sunny California days spent entertaining or relaxing with loved ones. Located within walking distance to shops, dining choices, and the 10 fwy. Don’t miss out on the opportunity to start your next chapter at this exceptional address that perfectly embodies Southern California living!
Features & Amenities
Property Details
Mortgage Calculator
Current Rates
Comparative Market Analysis
Affordable Tier · 4 active · 5 closed
Ontario · Condominium
Listed 4.5% below the median closed sale of $403,000.
Price Position
Aligned with the market — fair pricing for the comps.
Active Properties (4)
Active Comparables
| Address | City | Year | BD | BTH | SqFt | LotSz | LP/SqFt | LP | DIM | Score |
|---|---|---|---|---|---|---|---|---|---|---|
| 416 Imperial Avenue | Ontario | 1985 | 2 | 1 | 788 | 2,000 | $438 | $345,000 | 56 | 82 |
| 406 Imperial | Ontario | 1985 | 3 | 2 | 1,238 | 2,000 | $338 | $418,800 | 14 | 66 |
| 435 9th | Upland | 1979 | 2 | 2 | 951 | 951 | $410 | $390,000 | 65 | 65 |
| 508 N Imperial Ave. | Ontario | 1985 | 3 | 2 | 1,238 | 2,000 | $355 | $439,000 | 129 | 64 |
| Total: 4 · Average | 2.5 | 1.8 | 1,053.75 | 1,737.75 | $385.25 | $398,200 | 66 | |||
| Median | 1,238 | $418,800 | ||||||||
Closed Properties (5)
Closed Comparables
| Address | City | Year | Date | BD | BTH | SqFt | LotSz | LP | SP | SP/SqFt | SP/LP | DIM | Score |
|---|---|---|---|---|---|---|---|---|---|---|---|---|---|
| 8576 Salina | Rancho Cucamonga | 1986 | 06/02/2026 | 2 | 1 | 785 | 2,000 | $438,000 | $425,000 | $541 | 0.97 | 61 | 82 |
| 8358 Branchwood | Rancho Cucamonga | 1984 | 10/29/2026 | 2 | 1 | 718 | 1,400 | $409,000 | $403,000 | $561 | 0.98 | 71 | 80 |
| 1814 Vineyard Avenue | Ontario | 1983 | 07/13/2026 | 2 | 2 | 1,232 | 2,000 | $399,900 | $372,000 | $302 | 0.93 | 81 | 73 |
| 8309 Vineyard | Rancho Cucamonga | 1988 | 08/06/2026 | 2 | 2 | 882 | 900 | $425,000 | $430,000 | $488 | 1.01 | 50 | 71 |
| 8317 Vineyard | Rancho Cucamonga | 1988 | 02/04/2026 | 2 | 2 | 880 | 880 | $399,999 | $395,000 | $449 | 0.99 | 49 | 69 |
| Total: 5 · Average | 2.0 | 1.6 | 899.4 | 1,436 | $405,000 | $405,000 | $468.2 | — | 62.4 | ||||
| Median | 880 | $403,000 | $403,000 | ||||||||||
Market Analysis
List vs Sale $/SqFt
Sale Price Trend
Days on Market
Sale vs List Price
This analysis was generated automatically from MLS data. For an in-depth, human-reviewed valuation, contact Joseph Sardella at josephsardella@gmail.com.