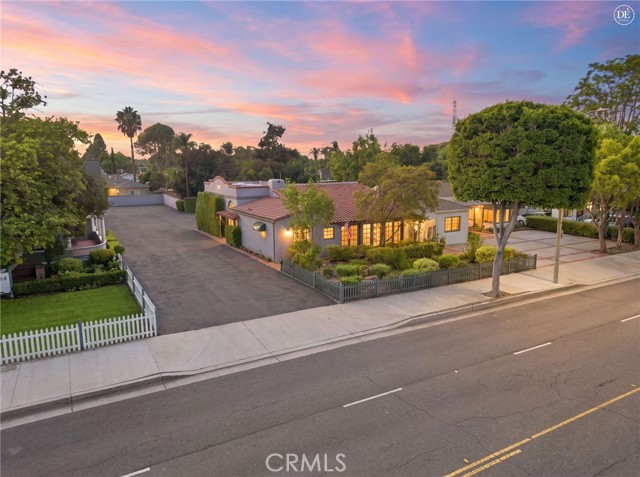
1324 East Chapman, Orange, CA 92866
1324 East Chapman, Orange, CA 92866
Property Description
Far from an ordinary office setting, this Palatial Spanish Revival is crowned by an iconic “Campanario” bell tower and offers over 2,000 sq. ft. of Extraordinary Character with 5 parking spaces. Just blocks from Old Towne Orange! Arched openings, Santo-style niches, Adobe-inspired wall texture, and dynamic, ornate tilework across floors and walls create a rich Old World Ambiance with a Bowers Museum-like feel. Thoughtfully refreshed with fresh interior paint, a new roof, upgraded plumbing and electrical, and revitalized landscaping. Zoned Office Professional with a prestigious Chapman Avenue presence. Truly one of a kind!
Features & Amenities
Property Details
Mortgage Calculator
Current Rates
Comparative Market Analysis
Residential Tier · 5 active · 5 closed
Orange · Single Family Residence
Listed 11.0% above the median closed sale of $1,350,000.
Price Position
Positioned above the market — commands a premium.
Active Properties (5)
Active Comparables
| Address | City | Year | BD | BTH | SqFt | LotSz | LP/SqFt | LP | DIM | Score |
|---|---|---|---|---|---|---|---|---|---|---|
| 1426 Sycamore | Orange | 1959 | 2 | 2 | 1,550 | 6,555 | $838 | $1.30M | 17 | 83 |
| 292 Waverly | Orange | 1924 | 3 | 1 | 1,328 | 5,670 | $971 | $1.29M | 114 | 80 |
| 340 Wayfield | Orange | 1957 | 3 | 2 | 1,491 | 7,186 | $889 | $1.32M | 16 | 79 |
| 1408 Fairway Dr | Orange | 1963 | 4 | 2 | 1,797 | 7,700 | $715 | $1.28M | 54 | 77 |
| 527 Park | Orange | 1952 | 3 | 2 | 1,786 | 10,392 | $728 | $1.30M | 70 | 75 |
| Total: 5 · Average | 3.0 | 1.8 | 1,590.4 | 7,500.6 | $828.2 | $1.30M | 54.2 | |||
| Median | 1,550 | $1.30M | ||||||||
Closed Properties (5)
Closed Comparables
| Address | City | Year | Date | BD | BTH | SqFt | LotSz | LP | SP | SP/SqFt | SP/LP | DIM | Score |
|---|---|---|---|---|---|---|---|---|---|---|---|---|---|
| 155 Lincoln | Orange | 1977 | 08/11/2026 | 4 | 2 | 1,728 | 6,380 | $1.35M | $1.35M | $781 | 1.00 | 33 | 82 |
| 262 Cambridge Street | Orange | 1921 | 06/05/2026 | 3 | 2 | 1,376 | 7,290 | $1.40M | $1.29M | $936 | 0.92 | 66 | 81 |
| 1133 Sycamore | Orange | 1958 | 08/10/2026 | 3 | 2 | 1,840 | 7,965 | $1.39M | $1.35M | $734 | 0.97 | 40 | 81 |
| 1314 Hickory | Orange | 1958 | 02/18/2026 | 3 | 2 | 2,000 | 7,680 | $1.43M | $1.40M | $698 | 0.98 | 39 | 80 |
| 1107 Sycamore | Orange | 1958 | 02/13/2026 | 6 | 3 | 2,245 | 7,965 | $1.40M | $1.40M | $624 | 1.00 | 38 | 73 |
| Total: 5 · Average | 3.8 | 2.2 | 1,837.8 | 7,456 | $1.36M | $1.36M | $754.6 | — | 43.2 | ||||
| Median | 1,840 | $1.35M | $1.35M | ||||||||||
Market Analysis
List vs Sale $/SqFt
Sale Price Trend
Days on Market
Sale vs List Price
This analysis was generated automatically from MLS data. For an in-depth, human-reviewed valuation, contact Joseph Sardella at josephsardella@gmail.com.