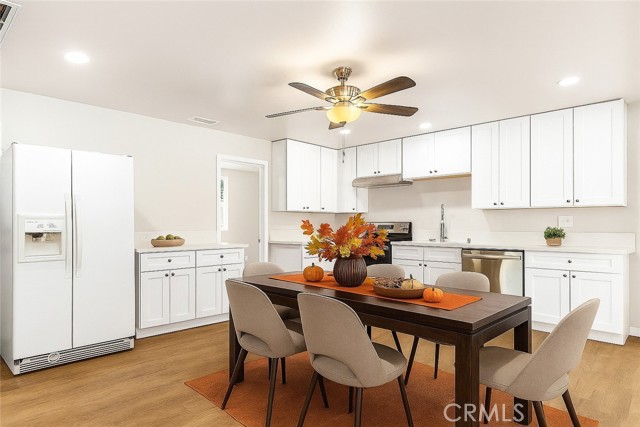
131 South Brandon Road, Fallbrook, CA 92028
131 South Brandon Road, Fallbrook, CA 92028
Property Description
BEST VALUE IN NORTH COUNTY SAN DIEGO, IN THE HEART OF FALLBROOK!– OPEN AND SPACIOUS - MOVE-IN READY, IN A GREAT LOCATION! This beautifully renovated 4-bedroom, 2-bath single-level home combines modern comfort, versatile space, and exciting FB-V3 MIXED-USE COMMERCIAL ZONING. Located just a few minutes from Main Street where you can dine, shop and maybe catch a movie at Community Movie theater. Step inside to a bright, inviting interior featuring a stunning updated kitchen with new cabinetry, quartz countertops, stainless-steel appliances, and a large utility sink. Thoughtfully upgraded with beautiful LVP flooring, new carpet in all bedrooms, updated bathrooms, double-pane windows, recessed lighting, fresh paint, newer A/C, roof, water heater, New Ceiling fans. Home comes with copper plumbing— OVERSIZED AND PRIVATE FRONT PORCH - IDEAL FOR MEETINGS WITH CLIENTS. Parking is a standout feature, offering space for several vehicles, including a 2-car garage, 2-car carport, and additional parking for 3 more cars. The FB-V3 mixed-use zoning creates an exciting opportunity for a homeowner, entrepreneur, investor, or professional seeking a property with both residential appeal and potential commercial possibilities. Enjoy all that Fallbrook has to offer, from charming boutiques, cafés, restaurants, galleries, and local shops to its peaceful small-town atmosphere; and just a short drive to CAMP PENDLETON, THE BEACH AND THE TEMECULA WINE COUNTRY. A rare opportunity to own a beautifully updated home in a prime Fallbrook location with versatile mixed-use zoning, abundant parking, and outstanding value! *Buyer to verify zoning, permitted uses, parking and all property information with appropriate agencies.*
Features & Amenities
Property Details
Mortgage Calculator
Current Rates
About Fallbrook
This property is located in Fallbrook, a community in Fallbrook. Explore more listings in this neighborhood to compare options and pricing.
View Fallbrook ListingsComparative Market Analysis
Residential Tier · 5 active · 5 closed
Fallbrook · Fallbrook · Single Family Residence
Listed 8.5% below the median closed sale of $710,000. Price per sqft ($371) is a 29% discount to closed comps ($519). Closed comps sold at 101% of list — strong seller's market.
Price Position
Priced below the market — value advantage over the field.
Active Properties (5)
Active Comparables
| Address | City | Year | BD | BTH | SqFt | LotSz | LP/SqFt | LP | DIM | Score |
|---|---|---|---|---|---|---|---|---|---|---|
| 711 De Luz Road | Fallbrook | 1978 | 3 | 2 | 1,520 | 9,583 | $477 | $724,999 | 79 | 70 |
| 1020 LA SOLANA | Fallbrook | 1973 | 3 | 2 | 1,400 | 10,890 | $499 | $699,000 | 33 | 69 |
| 1066 RIDGE HEIGHTS Drive | Fallbrook | 1990 | 2 | 2 | 1,839 | 7,405 | $394 | $724,500 | 88 | 68 |
| 1061 Old Stage Road | Fallbrook | 1971 | 3 | 2 | 1,080 | 7,632 | $625 | $675,000 | 63 | 67 |
| 1734 Adalane Place | Fallbrook | 1978 | 3 | 2 | 1,346 | 15,784 | $516 | $695,000 | 147 | 65 |
| Total: 5 · Average | 2.8 | 2.0 | 1,437 | 10,258.8 | $502.2 | $703,699.8 | 82 | |||
| Median | 1,400 | $699,000 | ||||||||
Closed Properties (5)
Closed Comparables
| Address | City | Year | Date | BD | BTH | SqFt | LotSz | LP | SP | SP/SqFt | SP/LP | DIM | Score |
|---|---|---|---|---|---|---|---|---|---|---|---|---|---|
| 503 Potter | Fallbrook | 1960 | 12/19/2025 | 4 | 3 | 1,641 | 7,405 | $715,000 | $715,000 | $436 | 1.00 | 28 | 86 |
| 127 Brandenburg Lane | Fallbrook | 1959 | 10/21/2026 | 3 | 2 | 1,232 | 9,583 | $684,900 | $685,000 | $556 | 1.00 | 63 | 85 |
| 117 Morro Road | Fallbrook | 2003 | 05/11/2026 | 3 | 2 | 1,730 | 11,635 | $725,000 | $725,000 | $419 | 1.00 | 38 | 84 |
| 612 Main | Fallbrook | 1947 | 06/02/2026 | 3 | 2 | 1,200 | 6,970 | $649,900 | $660,000 | $550 | 1.02 | 50 | 84 |
| 127 College | Fallbrook | 1952 | 11/18/2025 | 3 | 2 | 1,119 | 12,197 | $700,000 | $710,000 | $634 | 1.01 | 31 | 78 |
| Total: 5 · Average | 3.2 | 2.2 | 1,384.4 | 9,558 | $699,000 | $699,000 | $519 | — | 42 | ||||
| Median | 1,232 | $710,000 | $710,000 | ||||||||||
Market Analysis
List vs Sale $/SqFt
Sale Price Trend
Days on Market
Sale vs List Price
This analysis was generated automatically from MLS data. For an in-depth, human-reviewed valuation, contact Joseph Sardella at josephsardella@gmail.com.