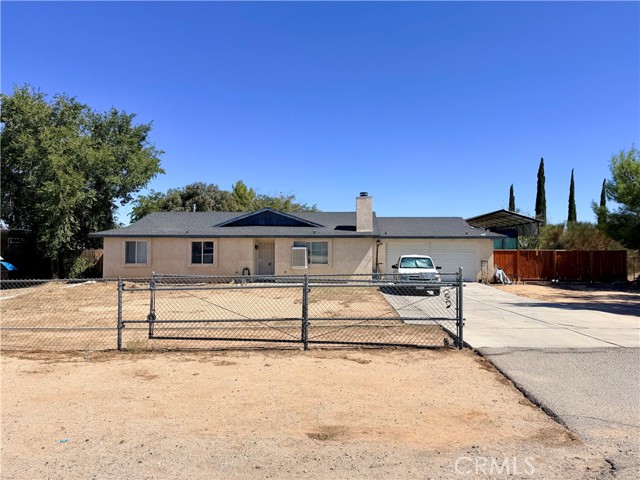
12839 Running Deer Road, Apple Valley, CA 92308
12839 Running Deer Road, Apple Valley, CA 92308
Property Description
PRICE DROP TODAY! PERFECT STARTER HOME IN APPLE VALLEY IN A QUIET NEIGHBORHOOD. THIS 3 BEDROOM, 2 BATH HOME HAS LOTS OF UPGRADES ALREADY INCLUDING PAID SOLAR, NEW AC & WATER HEATER, ADDED INSULATION, WOOD LAMINATE FLOORING, KITCHEN WAS UPDATED A YEAR AGO WITH GRANITE COUNTER TOPS AND CABINETS. THE BACKYARD HAS AN OVERSIZED COVERED BACK PATIO FOR LOTS OF SHADE. THERE'S PLENTY OF PARKING FOR A RV, BOAT OR TOY HAULER. DOUBLE GATE TO BACK YARD FOR EXTRA PARKING AS WELL AS PLENTY OF PARKING IN THE FRONT. THE SELLER ADDED A TILED WALK IN SHOWER AS WELL AS PAINTED THE INTERIOR OF THE HOME.
Features & Amenities
Property Details
Mortgage Calculator
Current Rates
Comparative Market Analysis
Affordable Tier · 5 active · 5 closed
Apple Valley · Single Family Residence
Listed 6.0% below the median closed sale of $420,000. Closed comps sold at 101% of list — strong seller's market.
Price Position
Priced below the market — value advantage over the field.
Active Properties (5)
Active Comparables
| Address | City | Year | BD | BTH | SqFt | LotSz | LP/SqFt | LP | DIM | Score |
|---|---|---|---|---|---|---|---|---|---|---|
| 13146 Mohawk | Apple Valley | 2005 | 3 | 2 | 1,216 | 20,998 | $317 | $385,000 | 181 | 89 |
| 12724 Algonquin | Apple Valley | 1985 | 3 | 2 | 1,228 | 18,000 | $338 | $415,000 | 6 | 88 |
| 12787 Algonquin Road | Apple Valley | 1986 | 3 | 2 | 1,130 | 18,645 | $335 | $379,000 | 17 | 87 |
| 12744 Running Deer | Apple Valley | 1986 | 3 | 2 | 1,678 | 17,821 | $256 | $429,000 | 26 | 79 |
| 13033 Chief Joseph | Apple Valley | 1957 | 3 | 2 | 1,843 | 19,152 | $228 | $420,000 | 146 | 71 |
| Total: 5 · Average | 3.0 | 2.0 | 1,419 | 18,923.2 | $294.8 | $405,600 | 75.2 | |||
| Median | 1,228 | $415,000 | ||||||||
Closed Properties (5)
Closed Comparables
| Address | City | Year | Date | BD | BTH | SqFt | LotSz | LP | SP | SP/SqFt | SP/LP | DIM | Score |
|---|---|---|---|---|---|---|---|---|---|---|---|---|---|
| 12794 Navajo | Apple Valley | 2003 | 04/29/2026 | 3 | 2 | 1,234 | 18,000 | $368,777 | $385,000 | $312 | 1.04 | 42 | 90 |
| 12760 Waynoka | Apple Valley | 1985 | 10/14/2026 | 3 | 2 | 1,196 | 18,000 | $370,000 | $375,000 | $314 | 1.01 | 47 | 88 |
| 12810 Navajo | Apple Valley | 1983 | 10/27/2026 | 3 | 2 | 1,300 | 18,000 | $410,000 | $420,000 | $323 | 1.02 | 12 | 87 |
| 13229 Algonquin Road | Apple Valley | 1983 | 07/15/2026 | 3 | 2 | 1,306 | 26,000 | $429,950 | $420,000 | $322 | 0.98 | 20 | 81 |
| 13071 Clallam Rd | Apple Valley | 2018 | 04/23/2026 | 3 | 2 | 1,649 | 21,300 | $450,000 | $445,000 | $270 | 0.99 | 50 | 77 |
| Total: 5 · Average | 3.0 | 2.0 | 1,337 | 20,260 | $409,000 | $409,000 | $308.2 | — | 34.2 | ||||
| Median | 1,300 | $420,000 | $420,000 | ||||||||||
Market Analysis
List vs Sale $/SqFt
Sale Price Trend
Days on Market
Sale vs List Price
This analysis was generated automatically from MLS data. For an in-depth, human-reviewed valuation, contact Joseph Sardella at josephsardella@gmail.com.