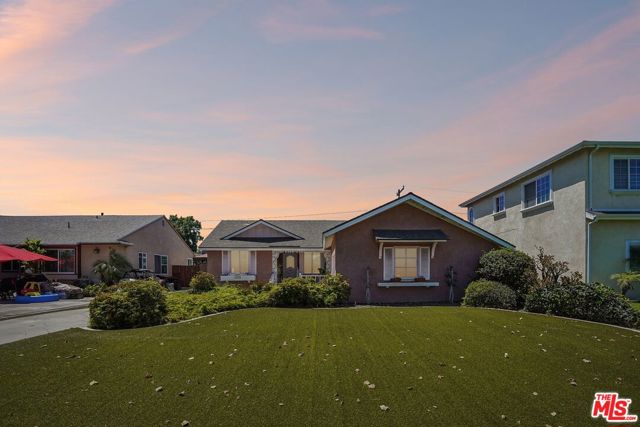
12825 Morning Avenue, Downey, CA 90242
12825 Morning Avenue, Downey, CA 90242
Property Description
This inviting 3-bedroom, 2-bathroom home located in a highly desirable Downey neighborhood. Offering a functional floor plan filled with natural light, this residence provides comfortable living with endless potential. Ideally situated near premier shopping, dining, parks, schools, and entertainment, with convenient access to major freeways for an easy commute throughout Los Angeles and Orange County. Enjoy the charm of a well-established community while being just minutes from everything Downey has to offer. A wonderful opportunity to own a home in one of Southeast Los Angeles County's most sought-after cities.
Features & Amenities
Property Details
Mortgage Calculator
Current Rates
Comparative Market Analysis
Affordable Tier · 5 active · 5 closed
Downey · Single Family Residence
Listed 5.1% below the median closed sale of $895,000. Closed comps sold at 101% of list — strong seller's market.
Price Position
Priced below the market — value advantage over the field.
Active Properties (5)
Active Comparables
| Address | City | Year | BD | BTH | SqFt | LotSz | LP/SqFt | LP | DIM | Score |
|---|---|---|---|---|---|---|---|---|---|---|
| 8243 Lankin | Downey | 1942 | 3 | 2 | 1,330 | 6,689 | $628 | $835,000 | 4 | 87 |
| 10614 Beak | South Gate | 1948 | 3 | 2 | 1,147 | 6,794 | $697 | $799,000 | 69 | 81 |
| 7312 Walnut Ave | Paramount | 1947 | 3 | 2 | 1,088 | 5,005 | $781 | $850,000 | 106 | 80 |
| 13944 Brightwell Avenue | Paramount | 1941 | 4 | 2 | 1,427 | 5,430 | $512 | $729,999 | 5 | 79 |
| 11442 Pomering Road | Downey | 1951 | 3 | 2 | 1,403 | 4,864 | $624 | $875,000 | 74 | 79 |
| Total: 5 · Average | 3.2 | 2.0 | 1,279 | 5,756.4 | $648.4 | $817,799.8 | 51.6 | |||
| Median | 1,330 | $835,000 | ||||||||
Closed Properties (5)
Closed Comparables
| Address | City | Year | Date | BD | BTH | SqFt | LotSz | LP | SP | SP/SqFt | SP/LP | DIM | Score |
|---|---|---|---|---|---|---|---|---|---|---|---|---|---|
| 7811 Adoree | Downey | 1953 | 10/14/2026 | 3 | 2 | 1,484 | 5,063 | $870,000 | $895,000 | $603 | 1.03 | 34 | 95 |
| 8166 Borson | Downey | 1947 | 09/02/2026 | 3 | 2 | 1,505 | 6,285 | $949,997 | $960,000 | $638 | 1.01 | 35 | 90 |
| 7810 Comolette Street | Downey | 1953 | 06/24/2026 | 3 | 2 | 1,216 | 5,214 | $815,000 | $865,000 | $711 | 1.06 | 50 | 90 |
| 8166 Borson Street | Downey | 1947 | 06/02/2026 | 3 | 2 | 1,505 | 6,285 | $775,000 | $772,500 | $513 | 1.00 | 40 | 88 |
| 7934 Comolette | Downey | 1953 | 09/02/2026 | 3 | 2 | 1,948 | 5,487 | $989,000 | $959,000 | $492 | 0.97 | 51 | 87 |
| Total: 5 · Average | 3.0 | 2.0 | 1,531.6 | 5,666.8 | $890,300 | $890,300 | $591.4 | — | 42 | ||||
| Median | 1,505 | $895,000 | $895,000 | ||||||||||
Market Analysis
List vs Sale $/SqFt
Sale Price Trend
Days on Market
Sale vs List Price
This analysis was generated automatically from MLS data. For an in-depth, human-reviewed valuation, contact Joseph Sardella at josephsardella@gmail.com.