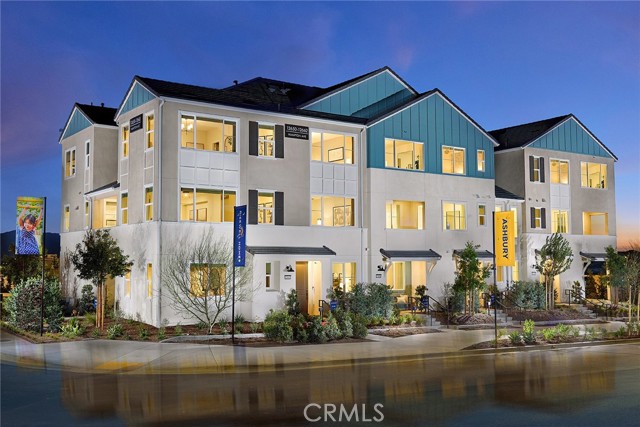
12705 Sahara (Ashbury 172) Street, Eastvale, CA 92880
12705 Sahara (Ashbury 172) Street, Eastvale, CA 92880
Property Description
This contemporary three-story floorplan offers stylish urban living with thoughtful versatility, beginning with a first-floor flex space perfect for a home office, gym, or creative studio, along with a 2-car tandem garage. The second level is the heart of the home, featuring an open concept layout with an expansive living area, a dining space ideal for entertaining, and a beautifully appointed kitchen boasting a centralized island, pantry, and access to a private deck. Upstairs, the third-floor retreat includes a generous primary suite with a walk-in closet and spa inspired en-suite bath, plus a secondary bedroom with its own full bath. With its smart layout, modern flow, and flexible spaces, this home is designed to elevate both everyday living and effortless hosting.
Features & Amenities
Property Details
Mortgage Calculator
Current Rates
Comparative Market Analysis
Residential Tier · 5 active · 5 closed
Eastvale · Townhouse
Listed 3.6% above the median closed sale of $525,990.
Price Position
Aligned with the market — fair pricing for the comps.
Active Properties (5)
Active Comparables
| Address | City | Year | BD | BTH | SqFt | LotSz | LP/SqFt | LP | DIM | Score |
|---|---|---|---|---|---|---|---|---|---|---|
| 5956 Yala (Bristol 258) Court | Eastvale | 2027 | 2 | 3 | 1,368 | 0 | $398 | $544,990 | 13 | 93 |
| 12692 Hampton Avenue | Eastvale | 2027 | 2 | 3 | 1,357 | 0 | $388 | $526,990 | 35 | 93 |
| 12786 Sazan Drive | Eastvale | 2026 | 3 | 3 | 1,579 | 0 | $380 | $599,990 | 35 | 91 |
| 12717 Sahara Street | Eastvale | 2026 | 3 | 3 | 1,626 | 0 | $357 | $579,990 | 122 | 91 |
| 5892 Rockport Road | Eastvale | 2027 | 3 | 3 | 1,605 | 0 | $387 | $620,990 | 35 | 90 |
| Total: 5 · Average | 2.6 | 3.0 | 1,507 | 0 | $382 | $574,590 | 48 | |||
| Median | 1,579 | $579,990 | ||||||||
Closed Properties (5)
Closed Comparables
| Address | City | Year | Date | BD | BTH | SqFt | LotSz | LP | SP | SP/SqFt | SP/LP | DIM | Score |
|---|---|---|---|---|---|---|---|---|---|---|---|---|---|
| 12707 Sahara Street | Eastvale | 2026 | 10/20/2026 | 2 | 3 | 1,578 | 0 | $549,990 | $514,990 | $326 | 0.94 | 96 | 100 |
| 5919 Gramercy Way | Eastvale | 2026 | 08/07/2026 | 2 | 3 | 1,578 | 0 | $540,990 | $525,990 | $333 | 0.97 | 45 | 99 |
| 12784 Bolsa Drive | Eastvale | 2026 | 09/20/2026 | 3 | 3 | 1,579 | 0 | $609,990 | $599,990 | $380 | 0.98 | 51 | 97 |
| 12721 Hampton Avenue | Eastvale | 2026 | 07/31/2026 | 2 | 3 | 1,357 | 0 | $524,990 | $524,990 | $387 | 1.00 | 37 | 95 |
| 12781 Bolsa Drive | Eastvale | 2026 | 09/17/2026 | 3 | 3 | 1,579 | 0 | $609,990 | $609,990 | $386 | 1.00 | 42 | 95 |
| Total: 5 · Average | 2.4 | 3.0 | 1,534.2 | 0 | $555,190 | $555,190 | $362.4 | — | 54.2 | ||||
| Median | 1,578 | $525,990 | $525,990 | ||||||||||
Market Analysis
List vs Sale $/SqFt
Sale Price Trend
Days on Market
Sale vs List Price
This analysis was generated automatically from MLS data. For an in-depth, human-reviewed valuation, contact Joseph Sardella at josephsardella@gmail.com.