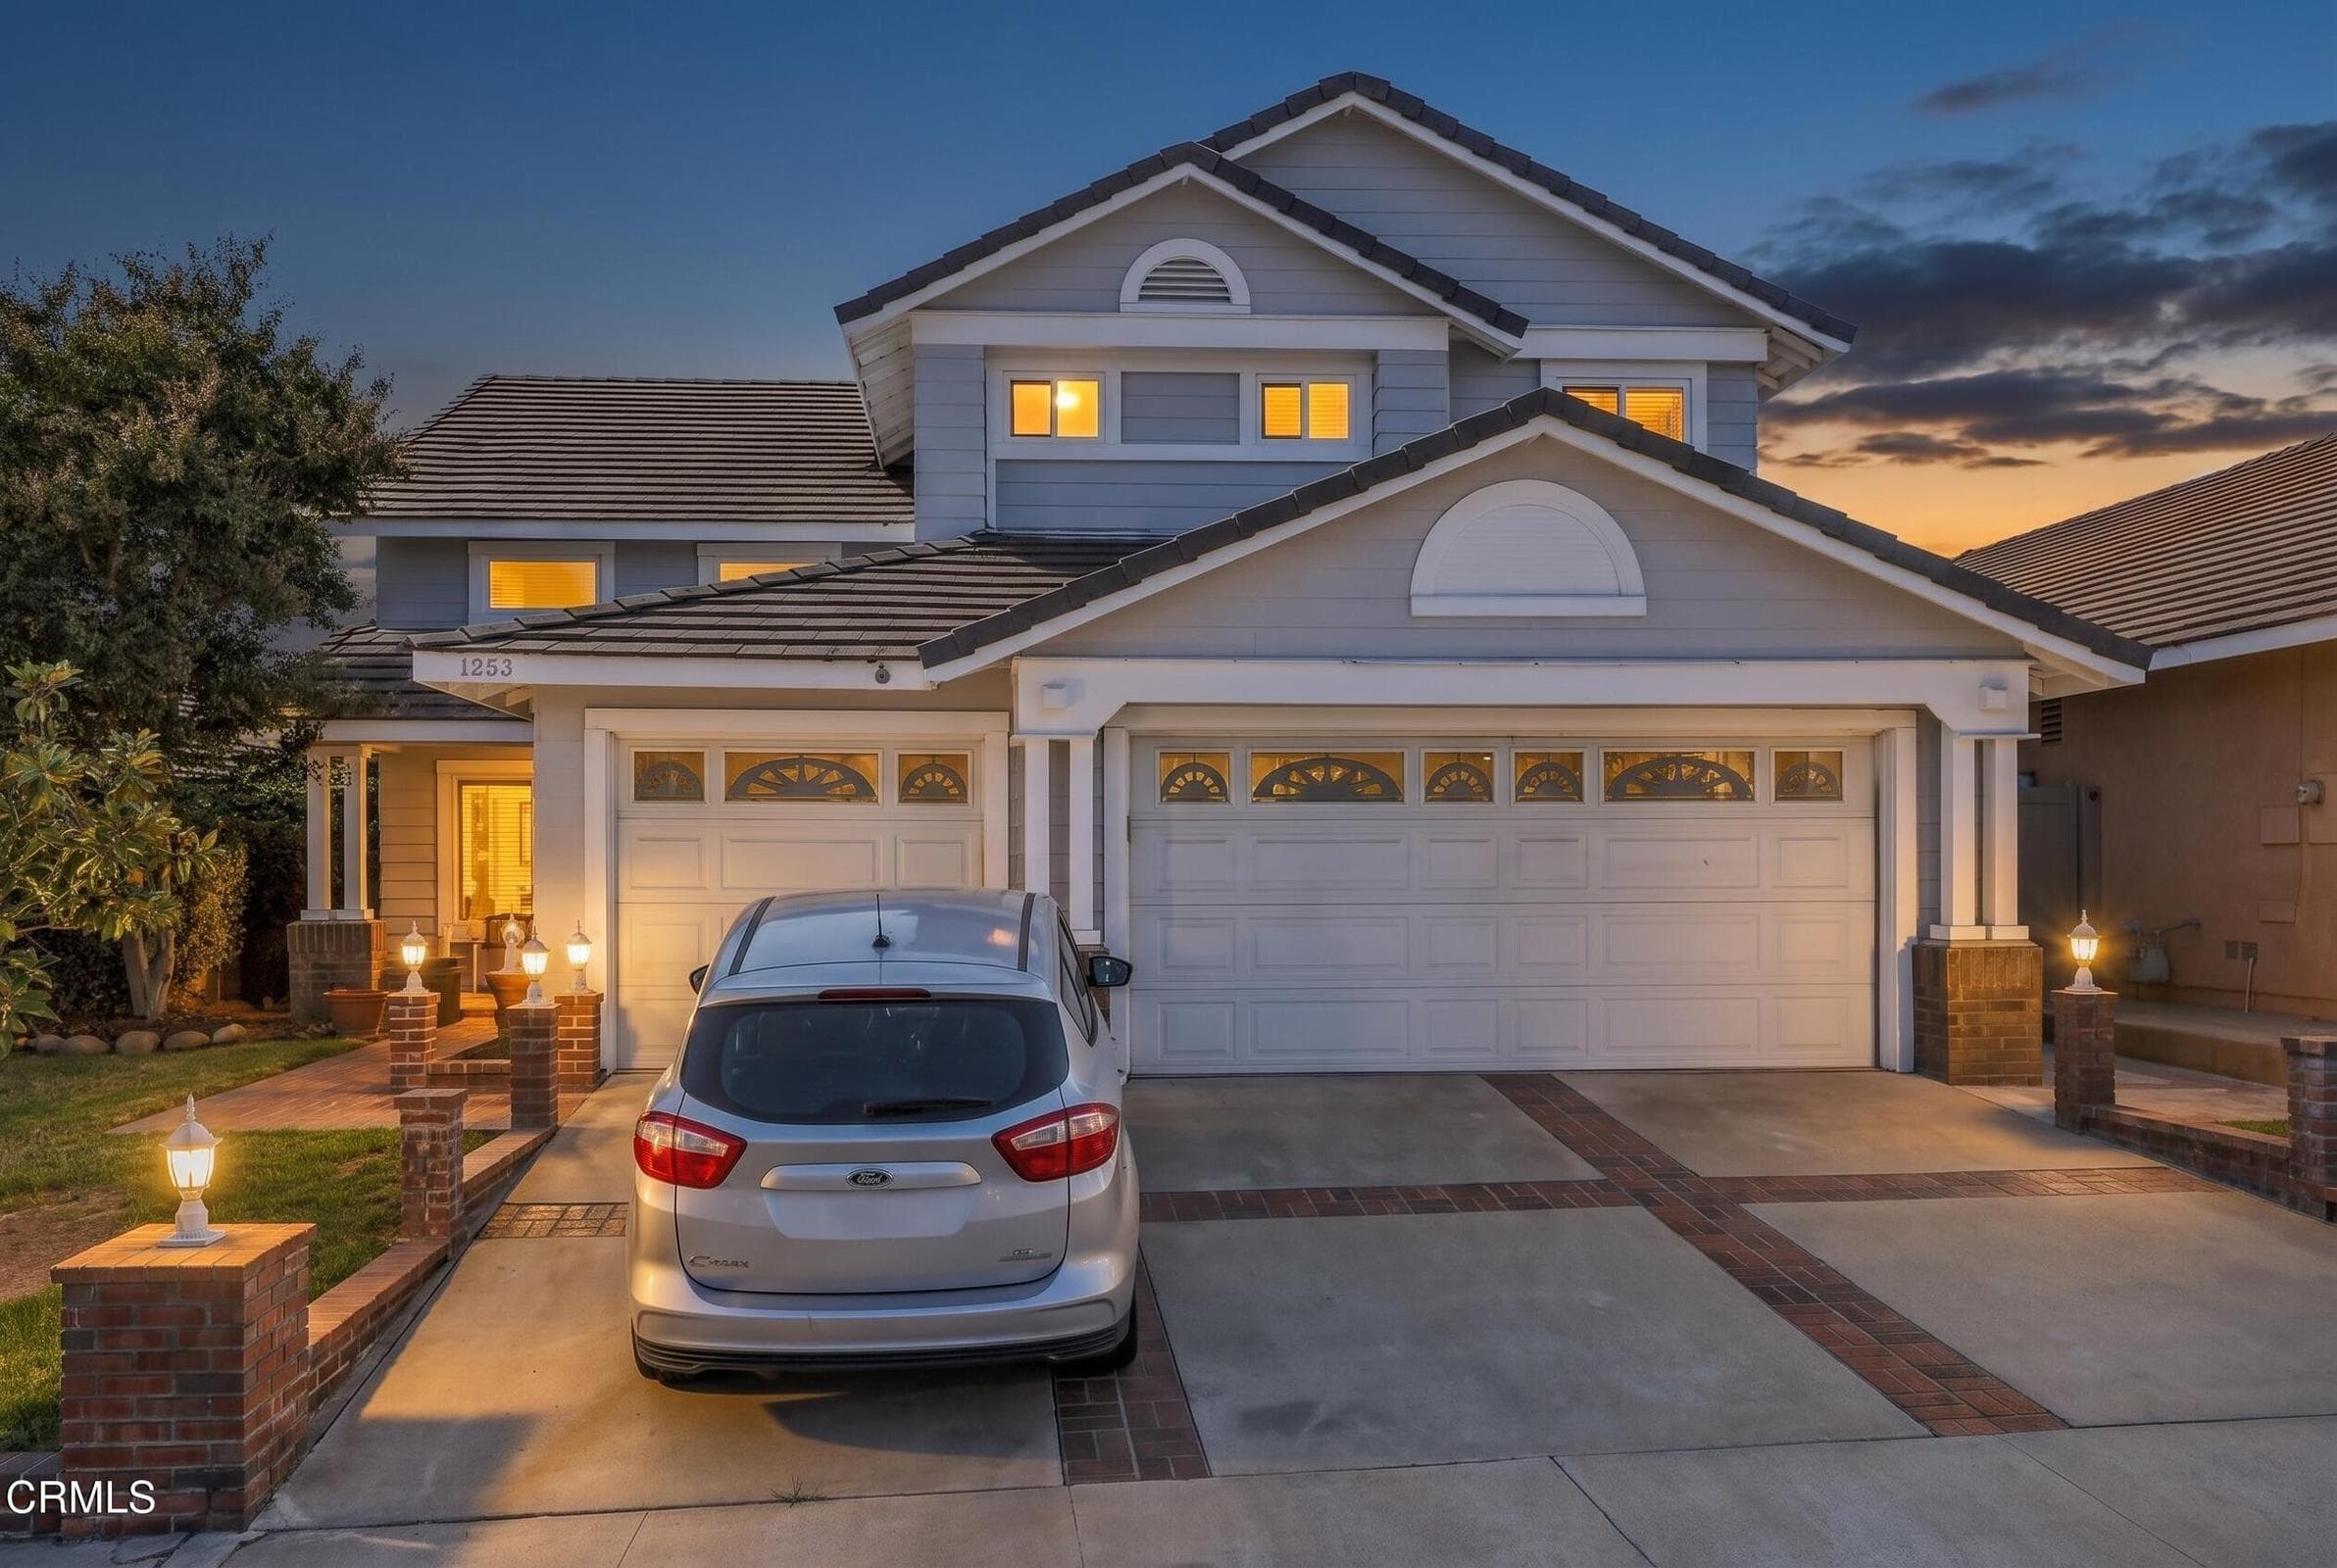
1253 Phelps Avenue, Ventura, CA 93004
1253 Phelps Avenue, Ventura, CA 93004
Property Description
Welcome to this turnkey home in a desirable East Ventura neighborhood, where thoughtful upgrades meet effortless living. From the moment you walk in, the attention to detail is unmistakable. Spanning over 2,100 square feet, this home features a recently installed elevator connecting the family room to the primary suite, a remodeled kitchen with stone counters and stainless appliances. Remodeled primary bath with dual sinks, and a gorgeous walk-in shower. Dual pane windows throughout, newer flooring in the living and dining rooms, and air conditioning throughout. A downstairs bedroom and bathroom offer flexible living -- ideal for guests or multi-generational families -- while the full 3-car garage and full driveway provides ample parking and storage. Outside, enjoy thoughtfully landscaped front and back yards designed with low maintenance in mind. Conveniently located near Huntsinger Park, shopping, schools, and restaurants -- with no HOA and no Mello-Roos.
Features & Amenities
Property Details
Mortgage Calculator
Current Rates
Comparative Market Analysis
Residential Tier · 5 active · 5 closed
Ventura · Single Family Residence
Listed 10.6% above the median closed sale of $1,080,000. Price per sqft ($560) is a 31% premium to closed comps ($428).
Price Position
Positioned above the market — commands a premium.
Active Properties (5)
Active Comparables
| Address | City | Year | BD | BTH | SqFt | LotSz | LP/SqFt | LP | DIM | Score |
|---|---|---|---|---|---|---|---|---|---|---|
| 10474 Mammoth Street | Ventura | 1995 | 4 | 3 | 2,135 | 5,050 | $515 | $1.10M | 112 | 96 |
| 1242 Crestlake Avenue | Ventura | 1977 | 4 | 3 | 2,265 | 6,098 | $457 | $1.03M | 21 | 86 |
| 9998 Jamestown Street | Ventura | 1989 | 3 | 3 | 1,703 | 4,486 | $645 | $1.10M | 38 | 86 |
| 10374 New Haven Street | Ventura | 2008 | 3 | 3 | 2,171 | 8,172 | $479 | $1.04M | 32 | 82 |
| 485 Tracy Place | Ventura | 2026 | 4 | 3 | 2,464 | 3,150 | $413 | $1.02M | 101 | 78 |
| Total: 5 · Average | 3.6 | 3.0 | 2,147.6 | 5,391.2 | $501.8 | $1.06M | 60.8 | |||
| Median | 2,171 | $1.04M | ||||||||
Closed Properties (5)
Closed Comparables
| Address | City | Year | Date | BD | BTH | SqFt | LotSz | LP | SP | SP/SqFt | SP/LP | DIM | Score |
|---|---|---|---|---|---|---|---|---|---|---|---|---|---|
| 615 Boston Avenue | Ventura | 2006 | 10/21/2026 | 4 | 4 | 2,515 | 6,234 | $1.08M | $1.07M | $427 | 0.99 | 110 | 83 |
| 967 Greensboro Road | Ventura | 1980 | 05/29/2026 | 4 | 3 | 2,334 | 6,969 | $999,000 | $1.02M | $439 | 1.03 | 34 | 80 |
| 1675 Arroyo Seco Drive | Ventura | 1984 | 11/07/2025 | 4 | 3 | 2,415 | 6,098 | $1.20M | $1.11M | $462 | 0.93 | 123 | 80 |
| 1651 Delores Court | Ventura | 2002 | 08/11/2026 | 4 | 4 | 2,658 | 7,840 | $1.15M | $1.14M | $427 | 0.99 | 62 | 77 |
| 10757 Citrus Drive | Ventura | 2026 | 10/07/2026 | 4 | 4 | 2,802 | 4,050 | $1.08M | $1.08M | $385 | 1.00 | 212 | 77 |
| Total: 5 · Average | 4.0 | 3.6 | 2,544.8 | 6,238.2 | $1.09M | $1.09M | $428 | — | 108.2 | ||||
| Median | 2,515 | $1.08M | $1.08M | ||||||||||
Market Analysis
List vs Sale $/SqFt
Sale Price Trend
Days on Market
Sale vs List Price
This analysis was generated automatically from MLS data. For an in-depth, human-reviewed valuation, contact Joseph Sardella at josephsardella@gmail.com.