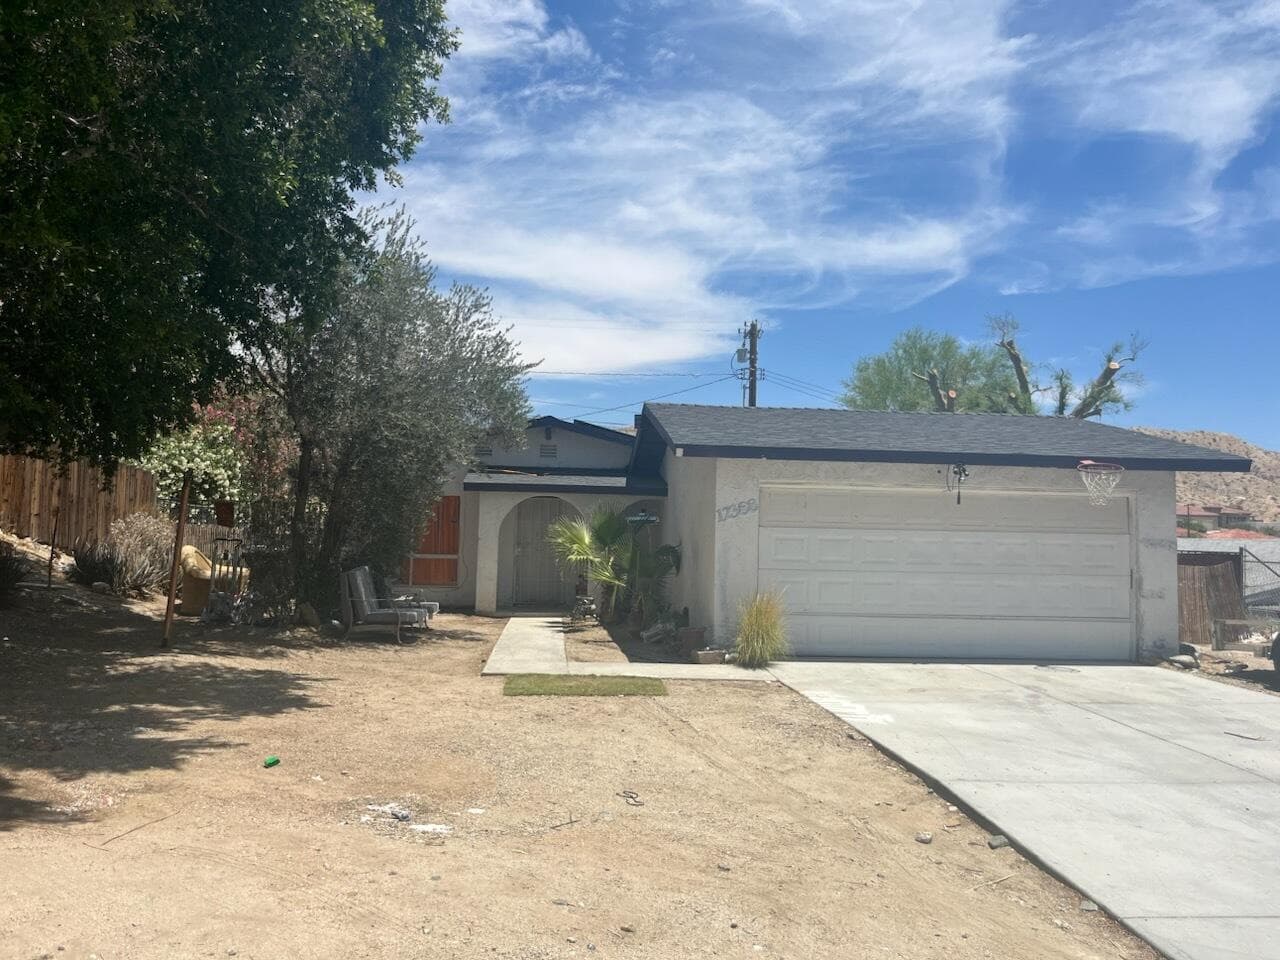
12388 Redbud Road, Desert Hot Springs, CA 92240
12388 Redbud Road, Desert Hot Springs, CA 92240
Property Description
Discover the potential of this charming 3-bedroom 2 bath home offering 1,134 sqft of living space in Desert Hot Springs. Fresh interior paint and marble flooring create a welcoming atmosphere, while the functional floor plan provides comfort and versatility. Step outside to a backyard with plenty of room to create your own sparkling pool, outdoor entertaining area or garden. Enjoy desert living with the opportunity to make this home truly your own. Motivated Seller
Features & Amenities
Property Details
Mortgage Calculator
Current Rates
Comparative Market Analysis
Affordable Tier · 5 active · 5 closed
Not Applicable · Desert Hot Springs · Single Family Residence
Listed 5.5% above the median closed sale of $365,000. Price per sqft ($340) is a 20% premium to closed comps ($284).
Price Position
Positioned above the market — commands a premium.
Active Properties (5)
Active Comparables
| Address | City | Year | BD | BTH | SqFt | LotSz | LP/SqFt | LP | DIM | Score |
|---|---|---|---|---|---|---|---|---|---|---|
| 12800 Avenida Serena | Desert Hot Springs | 1975 | 4 | 2 | 1,248 | 10,454 | $288 | $359,000 | 45 | 86 |
| 12950 Beech Avenue | Desert Hot Springs | 1990 | 3 | 2 | 1,479 | 7,841 | $240 | $355,000 | 54 | 84 |
| 13320 Calle Amapola | Desert Hot Springs | 1965 | 4 | 2 | 1,582 | 7,841 | $277 | $439,000 | 51 | 78 |
| 12735 Avenida Alta Loma | Desert Hot Springs | 1989 | 3 | 2 | 1,624 | 8,276 | $231 | $375,000 | 214 | 76 |
| 13753 Inaja Street | Desert Hot Springs | 2004 | 3 | 2 | 1,598 | 6,970 | $235 | $375,000 | 53 | 73 |
| Total: 5 · Average | 3.4 | 2.0 | 1,506.2 | 8,276.4 | $254.2 | $380,600 | 83.4 | |||
| Median | 1,582 | $375,000 | ||||||||
Closed Properties (5)
Closed Comparables
| Address | City | Year | Date | BD | BTH | SqFt | LotSz | LP | SP | SP/SqFt | SP/LP | DIM | Score |
|---|---|---|---|---|---|---|---|---|---|---|---|---|---|
| 13760 Hidalgo Street | Desert Hot Springs | 1990 | 06/10/2026 | 3 | 2 | 1,318 | 7,841 | $359,900 | $350,000 | $266 | 0.97 | 242 | 80 |
| 13400 Hidalgo Street | Desert Hot Springs | 1993 | 02/09/2026 | 3 | 2 | 1,209 | 7,405 | $355,000 | $355,000 | $294 | 1.00 | 32 | 79 |
| 13420 Inaja Street | Desert Hot Springs | 1992 | 03/02/2026 | 3 | 2 | 1,346 | 7,405 | $425,000 | $412,500 | $306 | 0.97 | 56 | 78 |
| 13702 Inaja Street | Desert Hot Springs | 2004 | 08/18/2026 | 3 | 2 | 1,210 | 7,405 | $365,000 | $365,000 | $302 | 1.00 | 137 | 76 |
| 12720 Cuando Way | Desert Hot Springs | 1991 | 02/18/2026 | 3 | 2 | 1,575 | 7,841 | $414,900 | $399,000 | $253 | 0.96 | 36 | 76 |
| Total: 5 · Average | 3.0 | 2.0 | 1,331.6 | 7,579.4 | $376,300 | $376,300 | $284.2 | — | 100.6 | ||||
| Median | 1,318 | $365,000 | $365,000 | ||||||||||
Market Analysis
List vs Sale $/SqFt
Sale Price Trend
Days on Market
Sale vs List Price
This analysis was generated automatically from MLS data. For an in-depth, human-reviewed valuation, contact Joseph Sardella at josephsardella@gmail.com.