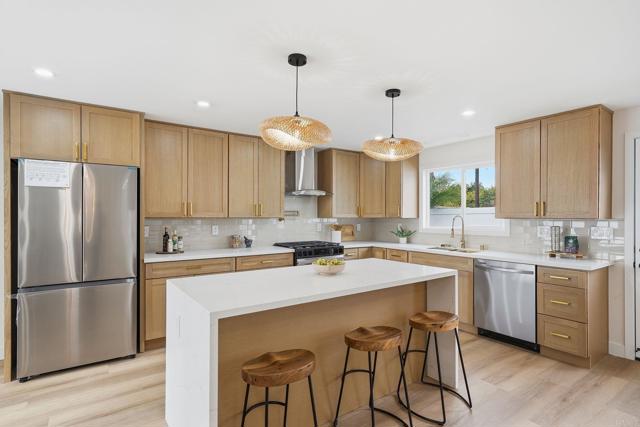
1224 Louden Lane, Imperial Beach, CA 91932
1224 Louden Lane, Imperial Beach, CA 91932
Property Description
Welcome to this beautifully renovated 3-bedroom, 2-bathroom home in Imperial Beach’s desirable Seaside Point neighborhood, just six blocks from the beach! Offering 1,353 sqft of thoughtfully designed living space, this home showcases gorgeous finishes and modern updates throughout. The open-concept floor plan creates a bright, inviting atmosphere perfect for everyday living and entertaining. Step outside to your own private backyard oasis featuring a sparkling pool and relaxing jacuzzi, ideal for hosting guests or enjoying sunny San Diego days. With its stunning renovation, stylish design, and prime coastal location, this home offers the perfect blend of modern luxury and laid-back beach living.
Features & Amenities
Property Details
Mortgage Calculator
Current Rates
Comparative Market Analysis
Affordable Tier · 5 active · 5 closed
Imperial Beach · Single Family Residence
Listed 9.6% above the median closed sale of $875,000.
Price Position
Positioned above the market — commands a premium.
Active Properties (5)
Active Comparables
| Address | City | Year | BD | BTH | SqFt | LotSz | LP/SqFt | LP | DIM | Score |
|---|---|---|---|---|---|---|---|---|---|---|
| 1250 Connecticut St | Imperial Beach | 1983 | 3 | 2 | 1,413 | 6,410 | $707 | $999,000 | 115 | 91 |
| 734 Carolina Street | Imperial Beach | 1954 | 3 | 2 | 1,159 | 0 | $819 | $949,000 | 45 | 81 |
| 1211 9th St | Imperial Beach | 1954 | 3 | 2 | 1,188 | 6,100 | $715 | $849,900 | 39 | 80 |
| 1165 East Lane | Imperial Beach | 1981 | 4 | 2 | 1,850 | 6,687 | $519 | $960,000 | 102 | 80 |
| 1016 Delaware St | Imperial Beach | 1969 | 4 | 3 | 1,799 | 4,050 | $610 | $1.10M | 101 | 70 |
| Total: 5 · Average | 3.4 | 2.2 | 1,481.8 | 5,811.75 | $674 | $970,980 | 80.4 | |||
| Median | 1,413 | $960,000 | ||||||||
Closed Properties (5)
Closed Comparables
| Address | City | Year | Date | BD | BTH | SqFt | LotSz | LP | SP | SP/SqFt | SP/LP | DIM | Score |
|---|---|---|---|---|---|---|---|---|---|---|---|---|---|
| 851 Holly Avenue | Imperial Beach | 1959 | 05/07/2026 | 3 | 2 | 1,316 | 6,000 | $925,000 | $911,000 | $692 | 0.98 | 57 | 80 |
| 737 Hemlock Avenue | Imperial Beach | 1960 | 06/26/2026 | 3 | 2 | 1,590 | 6,534 | $900,000 | $875,000 | $550 | 0.97 | 36 | 80 |
| 376 Bonito Avenue | Imperial Beach | 1952 | 06/10/2026 | 3 | 1 | 936 | 6,098 | $849,900 | $849,900 | $908 | 1.00 | 37 | 68 |
| 166 Citrus Avenue | Imperial Beach | 1953 | 04/10/2026 | 3 | 1 | 1,101 | 0 | $975,000 | $975,000 | $886 | 1.00 | 65 | 68 |
| 1223 12TH STREET | Imperial Beach | 2003 | 12/05/2025 | 4 | 3 | 1,743 | 3,150 | $849,000 | $850,000 | $488 | 1.00 | 32 | 66 |
| Total: 5 · Average | 3.2 | 1.8 | 1,337.2 | 5,445.5 | $892,180 | $892,180 | $704.8 | — | 45.4 | ||||
| Median | 1,316 | $875,000 | $875,000 | ||||||||||
Market Analysis
List vs Sale $/SqFt
Sale Price Trend
Days on Market
Sale vs List Price
This analysis was generated automatically from MLS data. For an in-depth, human-reviewed valuation, contact Joseph Sardella at josephsardella@gmail.com.