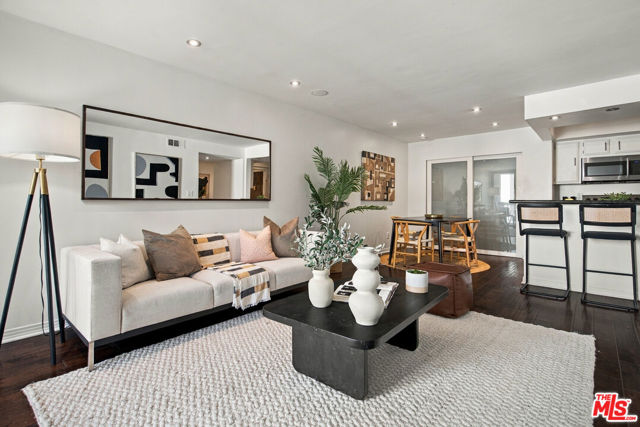
1215 North Olive Drive, 306, West Hollywood, CA 90069
1215 North Olive Drive, 306, West Hollywood, CA 90069
Property Description
One of West Hollywood's most sought-after streets, between the Sunset Strip and Santa Monica Blvd. Some of the city's best restaurants, shops and nightlife are close by. This 2-bedroom, 1-bath condo is well maintained and easy to live in. The living room opens to a private balcony overlooking the pool and lounge area. It's the spot for morning coffee or a quiet evening. The galley kitchen has granite countertops and a large pantry right next to it. Laundry is on every floor. The unit also comes with extra storage in the gated, secure garage. The grounds are landscaped and the pool is kept in excellent condition. A well-kept building on a great street in the heart of West Hollywood.
Features & Amenities
Property Details
Mortgage Calculator
Current Rates
Comparative Market Analysis
Affordable Tier · 5 active · 5 closed
West Hollywood · Condominium
Listed 5.3% above the median closed sale of $603,000. Closed comps sold at 102% of list — strong seller's market.
Price Position
Positioned above the market — commands a premium.
Active Properties (5)
Active Comparables
| Address | City | Year | BD | BTH | SqFt | LotSz | LP/SqFt | LP | DIM | Score |
|---|---|---|---|---|---|---|---|---|---|---|
| 1045 Kings Road | West Hollywood | 1968 | 2 | 1 | 910 | 20,000 | $658 | $599,000 | 61 | 93 |
| 1222 Olive Drive | West Hollywood | 1972 | 2 | 2 | 917 | 36,046 | $795 | $729,000 | 18 | 90 |
| 1221 Kings Road | West Hollywood | 1969 | 1 | 1 | 945 | 29,005 | $634 | $599,000 | 30 | 90 |
| 1250 Kings Road | West Hollywood | 1970 | 1 | 1 | 767 | 25,864 | $807 | $619,000 | 64 | 88 |
| 1021 Crescent Heights Boulevard | Los Angeles | 1974 | 2 | 2 | 949 | 12,102 | $764 | $725,000 | 38 | 87 |
| Total: 5 · Average | 1.6 | 1.4 | 897.6 | 24,603.4 | $731.6 | $654,200 | 42.2 | |||
| Median | 917 | $619,000 | ||||||||
Closed Properties (5)
Closed Comparables
| Address | City | Year | Date | BD | BTH | SqFt | LotSz | LP | SP | SP/SqFt | SP/LP | DIM | Score |
|---|---|---|---|---|---|---|---|---|---|---|---|---|---|
| 950 Kings Road | West Hollywood | 1973 | 09/29/2026 | 2 | 2 | 968 | 120,140 | $699,000 | $665,000 | $687 | 0.95 | 56 | 85 |
| 950 Kings Road | West Hollywood | 1973 | 08/21/2026 | 2 | 2 | 968 | 120,140 | $559,000 | $550,000 | $568 | 0.98 | 25 | 84 |
| 950 Kings Road | West Hollywood | 1973 | 08/07/2026 | 1 | 1 | 761 | 120,140 | $599,000 | $603,000 | $792 | 1.01 | 106 | 83 |
| 8490 Fountain | West Hollywood | 1969 | 01/13/2026 | 1 | 1 | 977 | 0 | $500,000 | $575,000 | $589 | 1.15 | 96 | 82 |
| 1328 Havenhurst Drive | West Hollywood | 1957 | 04/24/2026 | 2 | 2 | 919 | 14,140 | $699,000 | $699,000 | $761 | 1.00 | 55 | 82 |
| Total: 5 · Average | 1.6 | 1.6 | 918.6 | 93,640 | $618,400 | $618,400 | $679.4 | — | 67.6 | ||||
| Median | 968 | $603,000 | $603,000 | ||||||||||
Market Analysis
List vs Sale $/SqFt
Sale Price Trend
Days on Market
Sale vs List Price
This analysis was generated automatically from MLS data. For an in-depth, human-reviewed valuation, contact Joseph Sardella at josephsardella@gmail.com.