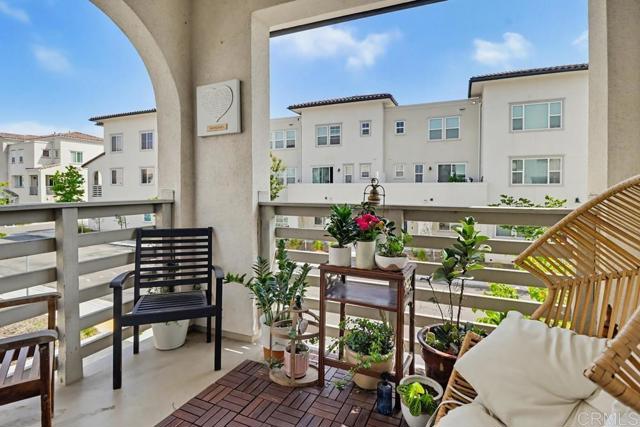
1205 Paseo Sea Cliff, 69, San Diego, CA 92154
1205 Paseo Sea Cliff, 69, San Diego, CA 92154
Property Description
Rare VA Assumable Loan at 4.375% — Save $900/Month vs. Today's Rates! Welcome to this beautifully upgraded corner end unit in the sought-after Playa Del Sol community. This tri-level home has 3 bedrooms, 2.5 bathrooms, and an attached 2-car garage — all with the added bonus of a VA assumable loan at 4.375%, saving a qualified buyer + $900 per month compared to current VA rates. Corner unit facing Northeast, you'll find a bright open layout between the kitchen and living room, plus a private balcony off the dining room. The home features luxury vinyl plank flooring throughout the entire home, quartz countertops, upgraded cabinetry, stainless appliances, in-unit laundry, and central heating and air conditioning. The gated community offers resort-style amenities including a fitness center, pool, spa, clubhouse, and BBQ area. Ideally situated near top-rated elementary, middle, and high schools, with easy access to freeways, the US/Mexico border, and shopping. This is a rare opportunity — don't miss it!
Features & Amenities
Property Details
Mortgage Calculator
Current Rates
Comparative Market Analysis
Affordable Tier · 5 active · 5 closed
San Diego · Condominium
Listed 12.0% above the median closed sale of $585,000. Closed comps sold at 101% of list — strong seller's market.
Price Position
Positioned above the market — commands a premium.
Active Properties (5)
Active Comparables
| Address | City | Year | BD | BTH | SqFt | LotSz | LP/SqFt | LP | DIM | Score |
|---|---|---|---|---|---|---|---|---|---|---|
| 5201 Beachside Ln | San Diego | 2018 | 3 | 3 | 1,696 | 0 | $348 | $589,999 | 20 | 94 |
| 760 Portside Pl | San Diego | 2005 | 3 | 3 | 1,400 | 0 | $442 | $619,000 | 29 | 90 |
| 5232 Beachfront | San Diego | 2021 | 4 | 3 | 1,702 | 0 | $370 | $629,000 | 45 | 89 |
| 1716 San Eugenio | San Diego | 2015 | 3 | 3 | 1,686 | 250,906 | $394 | $665,000 | 13 | 88 |
| 5491 Seacliff | San Diego | 2022 | 2 | 3 | 1,309 | 407,844 | $443 | $579,999 | 118 | 85 |
| Total: 5 · Average | 3.0 | 3.0 | 1,558.6 | 329,375 | $399.4 | $616,599.6 | 45 | |||
| Median | 1,686 | $619,000 | ||||||||
Closed Properties (5)
Closed Comparables
| Address | City | Year | Date | BD | BTH | SqFt | LotSz | LP | SP | SP/SqFt | SP/LP | DIM | Score |
|---|---|---|---|---|---|---|---|---|---|---|---|---|---|
| 1251 Paseo Sea Grass | San Diego | 2018 | 08/12/2026 | 3 | 3 | 1,452 | 0 | $620,000 | $635,000 | $437 | 1.02 | 48 | 97 |
| 5341 Calle Rockfish | San Diego | 2019 | 05/18/2026 | 2 | 3 | 1,339 | 233,475 | $569,900 | $565,000 | $422 | 0.99 | 75 | 90 |
| 5284 Beachfront Cove Street | San Diego | 2021 | 05/12/2026 | 2 | 3 | 1,310 | 0 | $585,000 | $585,000 | $447 | 1.00 | 56 | 88 |
| 5284 Beachfront Cove | San Diego | 2021 | 05/18/2026 | 2 | 3 | 1,310 | 250,747 | $580,000 | $580,000 | $443 | 1.00 | 66 | 88 |
| 5140 Calle Sand Arch | San Diego | 2017 | 12/31/2025 | 3 | 4 | 1,643 | 0 | $670,000 | $680,000 | $414 | 1.01 | 191 | 87 |
| Total: 5 · Average | 2.4 | 3.2 | 1,410.8 | 242,111 | $609,000 | $609,000 | $432.6 | — | 87.2 | ||||
| Median | 1,339 | $585,000 | $585,000 | ||||||||||
Market Analysis
List vs Sale $/SqFt
Sale Price Trend
Days on Market
Sale vs List Price
This analysis was generated automatically from MLS data. For an in-depth, human-reviewed valuation, contact Joseph Sardella at josephsardella@gmail.com.