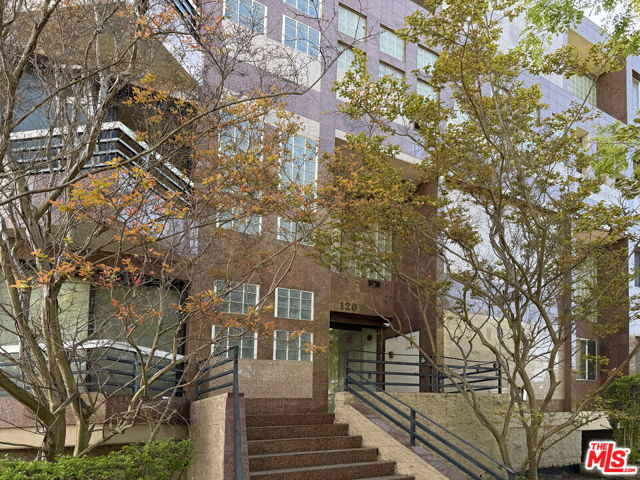
120 South Crescent Drive, 102, Beverly Hills, CA 90212
120 South Crescent Drive, 102, Beverly Hills, CA 90212
Property Description
Great Area, Prime of Beverly Hills, closer to Beverly Hills schools District. Experience the epitome of Beverly Hills living in this stunning 3 bedrooms 3 bathrooms Townhouse style condo building. located in the Heart of the city, enjoy the convenience of being close to top -rated schools, including in the world-class shopping on Rodeo Drive and Savory the vibrant dining scene. This is elegant residence boasts open floor plan. cozy fireplace, private balconies. laundry 's in the unit & including 3 side by side parking spaces. also available to lease too. Easy to show, Call or text listing agent.
Features & Amenities
Property Details
Mortgage Calculator
Current Rates
Comparative Market Analysis
Residential Tier · 5 active · 5 closed
Beverly Hills · Condominium
Listed 5.1% below the median closed sale of $1,475,000.
Price Position
Priced below the market — value advantage over the field.
Active Properties (5)
Active Comparables
| Address | City | Year | BD | BTH | SqFt | LotSz | LP/SqFt | LP | DIM | Score |
|---|---|---|---|---|---|---|---|---|---|---|
| 120 Crescent Drive | Beverly Hills | 1989 | 3 | 3 | 2,141 | 11,584 | $701 | $1.50M | 176 | 87 |
| 121 Almont Drive | Beverly Hills | 1993 | 3 | 3 | 2,177 | 16,642 | $678 | $1.48M | 16 | 86 |
| 121 Canon Drive | Beverly Hills | 1996 | 2 | 3 | 2,047 | 11,881 | $730 | $1.50M | 17 | 86 |
| 121 Almont Drive | Beverly Hills | 1993 | 2 | 3 | 1,860 | 16,642 | $858 | $1.59M | 48 | 77 |
| 318 Maple Drive | Beverly Hills | 1974 | 2 | 3 | 1,989 | 37,512 | $646 | $1.28M | 131 | 76 |
| Total: 5 · Average | 2.4 | 3.0 | 2,042.8 | 18,852.2 | $722.6 | $1.47M | 77.6 | |||
| Median | 2,047 | $1.50M | ||||||||
Closed Properties (5)
Closed Comparables
| Address | City | Year | Date | BD | BTH | SqFt | LotSz | LP | SP | SP/SqFt | SP/LP | DIM | Score |
|---|---|---|---|---|---|---|---|---|---|---|---|---|---|
| 121 Palm Drive | Beverly Hills | 1974 | 09/16/2026 | 3 | 4 | 2,113 | 18,215 | $1.60M | $1.60M | $757 | 1.00 | 55 | 83 |
| 121 Almont Drive | Beverly Hills | 1993 | 12/05/2025 | 2 | 3 | 1,775 | 16,642 | $1.50M | $1.48M | $831 | 0.99 | 95 | 76 |
| 320 Maple Drive | Beverly Hills | 1974 | 06/15/2026 | 2 | 3 | 2,090 | 37,512 | $1.38M | $1.25M | $597 | 0.91 | 131 | 75 |
| 132 Maple Drive | Beverly Hills | 2002 | 08/19/2026 | 3 | 3 | 2,247 | 17,843 | $1.48M | $1.30M | $579 | 0.88 | 167 | 74 |
| 9249 Burton Way | Beverly Hills | 1988 | 04/27/2026 | 2 | 3 | 1,588 | 20,812 | $1.40M | $1.50M | $945 | 1.07 | 44 | 69 |
| Total: 5 · Average | 2.4 | 3.2 | 1,962.6 | 22,204.8 | $1.42M | $1.42M | $741.8 | — | 98.4 | ||||
| Median | 2,090 | $1.48M | $1.48M | ||||||||||
Market Analysis
List vs Sale $/SqFt
Sale Price Trend
Days on Market
Sale vs List Price
This analysis was generated automatically from MLS data. For an in-depth, human-reviewed valuation, contact Joseph Sardella at josephsardella@gmail.com.