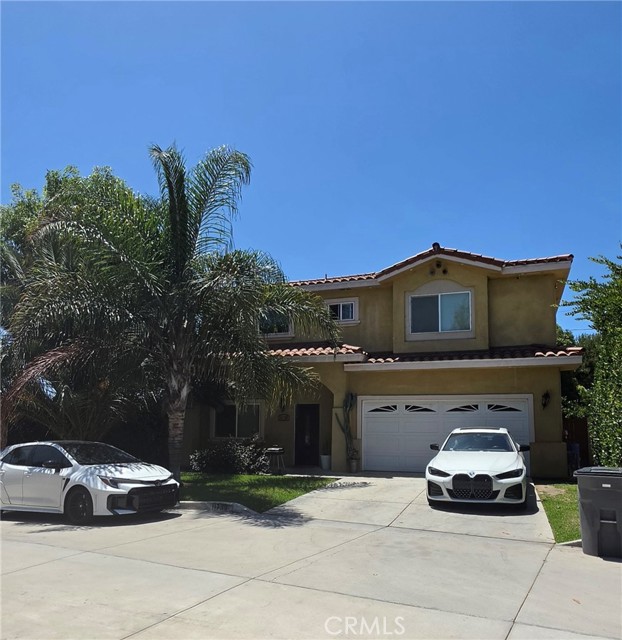
11739 THORSON Avenue, Lynwood, CA 90262
11739 THORSON Avenue, Lynwood, CA 90262
Property Description
Single-family home with high-quality luxury finishes, including beautiful laminate flooring, Moen hardware arched window,gas fireplace, open floor plan.Beutifull light filled kitchen with lots of storgage space. This home features a whole-house water filtration system, an EV charging station, and high-quality window coverings designed to block out exterior light when closed. This beautiful home come with a large priate back yard and front yard. located in a great establised neighborhood situated near transportation, shopping center.
Features & Amenities
Property Details
Mortgage Calculator
Current Rates
Comparative Market Analysis
Residential Tier · 5 active · 5 closed
Lynwood · Single Family Residence
Listed 13.3% above the median closed sale of $750,000. Price per sqft ($417) is a 16% discount to closed comps ($496).
Price Position
Positioned above the market — commands a premium.
Active Properties (5)
Active Comparables
| Address | City | Year | BD | BTH | SqFt | LotSz | LP/SqFt | LP | DIM | Score |
|---|---|---|---|---|---|---|---|---|---|---|
| 4170 Lavinia | Lynwood | 1953 | 3 | 2 | 1,791 | 5,577 | $441 | $789,999 | 46 | 86 |
| 3816 Walnut | Lynwood | 1940 | 3 | 2 | 1,698 | 4,807 | $442 | $750,000 | 180 | 81 |
| 11098 Hulme | Lynwood | 1942 | 3 | 3 | 1,524 | 5,988 | $495 | $755,000 | 176 | 78 |
| 12506 Mona | Compton | 2001 | 4 | 3 | 1,955 | 3,250 | $425 | $829,999 | 24 | 74 |
| 10962 Elm Avenue | Lynwood | 1940 | 4 | 2 | 1,810 | 6,549 | $439 | $795,000 | 45 | 74 |
| Total: 5 · Average | 3.4 | 2.4 | 1,755.6 | 5,234.2 | $448.4 | $783,999.6 | 94.2 | |||
| Median | 1,791 | $789,999 | ||||||||
Closed Properties (5)
Closed Comparables
| Address | City | Year | Date | BD | BTH | SqFt | LotSz | LP | SP | SP/SqFt | SP/LP | DIM | Score |
|---|---|---|---|---|---|---|---|---|---|---|---|---|---|
| 4024 Lugo Ave | Lynwood | 1946 | 05/27/2026 | 3 | 2 | 1,700 | 6,288 | $755,000 | $775,000 | $456 | 1.03 | 48 | 82 |
| 4296 Walnut Avenue | Lynwood | 1946 | 12/11/2025 | 3 | 2 | 2,086 | 6,290 | $750,000 | $750,000 | $360 | 1.00 | 178 | 80 |
| 3936 Carlin Ave | Lynwood | 1951 | 04/30/2026 | 4 | 2 | 1,989 | 6,957 | $775,000 | $768,000 | $386 | 0.99 | 97 | 79 |
| 3886 Cortland Street | Lynwood | 1939 | 04/15/2026 | 3 | 2 | 1,292 | 5,234 | $753,999 | $735,000 | $569 | 0.97 | 198 | 78 |
| 4020 Josephine | Lynwood | 1941 | 10/16/2026 | 3 | 1 | 1,028 | 5,233 | $728,000 | $728,000 | $708 | 1.00 | 71 | 78 |
| Total: 5 · Average | 3.2 | 1.8 | 1,619 | 6,000.4 | $751,200 | $751,200 | $495.8 | — | 118.4 | ||||
| Median | 1,700 | $750,000 | $750,000 | ||||||||||
Market Analysis
List vs Sale $/SqFt
Sale Price Trend
Days on Market
Sale vs List Price
This analysis was generated automatically from MLS data. For an in-depth, human-reviewed valuation, contact Joseph Sardella at josephsardella@gmail.com.