1 / 31
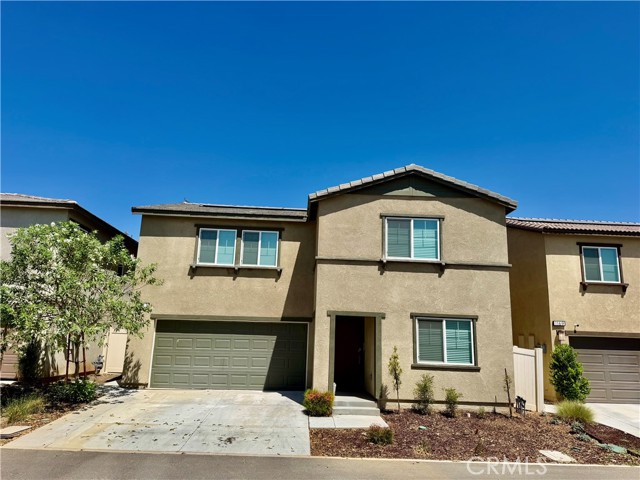
1173 Rockcress, Banning, CA 92220
$509K4bd · 3ba · 2,282 sqft
Lot 3,920 sqft•HOA $202/mo•Single Family Residence•Active•68d on market•MLS# OC-26187829
1173 Rockcress, Banning, CA 92220
MLS# OC-26187829•Residential•Single Family Residence
Active68 days on market
$509,200
4
Beds
3
Baths
2,282
Sq Ft
3,920
Lot Sq Ft
$202
HOA/mo
2023
Year Built
Canyon, Mountain(s)
View
Property Description
Welcome to this stunning two-story home, perfectly designed for modern living and comfort. This beautifully maintained property features 4 spacious bedrooms and 3 full bathrooms, offering an ideal layout for growing families or multi-generational households.
Features & Amenities
FeeBuilt 2023
Property Details
Land Type
Fee
Year Built
2023
Property Type
Residential
Property Subtype
Single Family Residence
Parking Spaces
2
Garage Spaces
2
Heating
Central
Cooling
Central Air
View
Canyon, Mountain(s)
City
Banning
Zip Code
92220
County
Riverside
Mortgage Calculator
Current Rates
$
$
%
Monthly Payment
$2,574.79
Principal & Interest
Loan Amount
$407,360
Total Interest
$519,565
Total Payment Over 30 Years
$926,925
This calculator provides estimates only. Actual mortgage payments may include taxes, insurance, HOA fees, and PMI. Contact a lender for accurate quotes.
Comparative Market Analysis
Residential Tier · 5 active · 5 closed
1173 Rockcress, Banning, CA 92220
Banning · Single Family Residence
$509K
Residential TierBeds
4
Baths
3
Sqft
2,282
Lot
3,920 sqft
Year
2023
$/Sqft
$223
Pool: No✓
View: mountain✓
Garage: 2-car✓
Listed 3.9% above the median closed sale of $490,000. Closed comps sold at 102% of list — strong seller's market. Expect a longer timeline — comps averaged 120 days on market.
Price Position
Aligned with the market — fair pricing for the comps.
At market
Subject listed at $509K· $223/sqft
Total list price
Closed comps
vs closed median $490K
+$19K (+3.9%)
Active comps
vs active median $506K
+$3K (+0.6%)
Price per sqft
Closed compsinsufficient comp data
Active comps
vs active avg $/sqft $245
−$22 (−9.1%)
Active Properties (5)
Active Comparables
| Address | City | Year | BD | BTH | SqFt | LotSz | LP/SqFt | LP | DIM | Score |
|---|---|---|---|---|---|---|---|---|---|---|
| 1248 Goldenbrush Way | Banning | 2023 | 3 | 3 | 1,787 | 3,049 | $257 | $458,888 | 40 | 91 |
| 1131 Rockcress | Banning | 2023 | 4 | 3 | 2,282 | 5,227 | $219 | $499,000 | 47 | 90 |
| 5123 Eureka Avenue | Banning | 2025 | 3 | 3 | 1,958 | 4,792 | $267 | $523,000 | 18 | 89 |
| 1702 Magnolia Place | Banning | 2024 | 4 | 4 | 2,180 | 6,098 | $252 | $550,000 | 45 | 88 |
| 5538 Kiwi Court | Banning | 2027 | 4 | 3 | 2,195 | 5,496 | $231 | $506,000 | 15 | 85 |
| Total: 5 · Average | 3.6 | 3.2 | 2,080.4 | 4,932.4 | $245.2 | $507,377.6 | 33 | |||
| Median | 2,180 | $506,000 | ||||||||
Closed Properties (5)
Closed Comparables
| Address | City | Year | Date | BD | BTH | SqFt | LotSz | LP | SP | SP/SqFt | SP/LP | DIM | Score |
|---|---|---|---|---|---|---|---|---|---|---|---|---|---|
| 1489 Goldenbrush Way | Banning | 2024 | 08/13/2026 | 4 | 3 | 2,024 | 3,485 | $450,000 | $465,000 | $230 | 1.03 | 204 | 94 |
| 1122 Rockcress Lane | Banning | 2023 | 08/03/2026 | 3 | 3 | 2,024 | 3,920 | $450,000 | $450,000 | $222 | 1.00 | 55 | 93 |
| 1072 Rockcress | Banning | 2023 | 06/18/2026 | 4 | 3 | 2,024 | 4,356 | $484,900 | $500,000 | $247 | 1.03 | 70 | 88 |
| 5460 Larkspur Road | Banning | 2026 | 09/23/2026 | 4 | 3 | 2,024 | 4,280 | $482,688 | $495,363 | $245 | 1.03 | 151 | 87 |
| 5130 Larkspur Road | Banning | 2023 | 06/03/2026 | 3 | 2 | 1,764 | 4,792 | $490,000 | $490,000 | $278 | 1.00 | 118 | 86 |
| Total: 5 · Average | 3.6 | 2.8 | 1,972 | 4,166.6 | $480,072.6 | $480,072.6 | $244.4 | — | 119.6 | ||||
| Median | 2,024 | $490,000 | $490,000 | ||||||||||
Market Analysis
List vs Sale $/SqFt
Sale Price Trend
Days on Market
Sale vs List Price
AI-generated CMA
This analysis was generated automatically from MLS data. For an in-depth, human-reviewed valuation, contact Joseph Sardella at josephsardella@gmail.com.