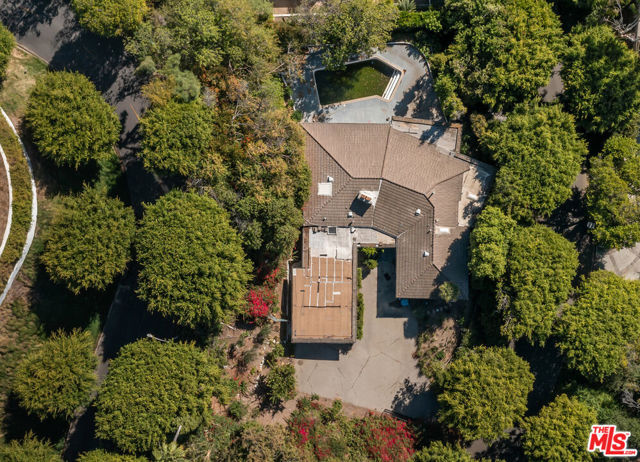
1150 Laurel Way, Beverly Hills, CA 90210
1150 Laurel Way, Beverly Hills, CA 90210
Property Description
Redevelopment opportunity on coveted Laurel Way in prime Beverly Hills. Set among some of the city's most distinguished estates.Situated on a generous lot in the heart of the prestigious 90210, this property has a rare combination of land, location, and extraordinary potential to design and build a legacy estate tailored to your vision. An unparalleled offering for developers, investors, or end-users seeking to create a signature Beverly Hills residence.
Features & Amenities
Property Details
Mortgage Calculator
Current Rates
Comparative Market Analysis
Luxury Tier · 5 active · 5 closed
Beverly Hills · Single Family Residence
Listed 7.6% below the median closed sale of $4,325,000. Luxury tier — fewer comparable sales widen the confidence range.
Price Position
Priced below the market — value advantage over the field.
Active Properties (5)
Active Comparables
| Address | City | Year | BD | BTH | SqFt | LotSz | LP/SqFt | LP | DIM | Score |
|---|---|---|---|---|---|---|---|---|---|---|
| 1311 Beverly Drive | Los Angeles | 1957 | 4 | 4 | 3,000 | 8,738 | $1,298 | $3.90M | 51 | 83 |
| 9422 Readcrest Drive | Beverly Hills | 1955 | 3 | 3 | 2,554 | 13,866 | $1,368 | $3.50M | 157 | 68 |
| 1454 Blueridge Drive | Los Angeles | 1936 | 4 | 4 | 3,274 | 9,953 | $1,220 | $4.00M | 48 | 67 |
| 1309 Laurel Way | Beverly Hills | 1965 | 0 | 0 | 0 | 21,156 | $0 | $3.50M | 208 | 61 |
| 9430 Readcrest Drive | Beverly Hills | 1955 | 6 | 7 | 5,000 | 10,091 | $780 | $3.90M | 44 | 49 |
| Total: 5 · Average | 3.4 | 3.6 | 3,457 | 12,760.8 | $1,166.5 | $3.76M | 101.6 | |||
| Median | 3,274 | $3.90M | ||||||||
Closed Properties (5)
Closed Comparables
| Address | City | Year | Date | BD | BTH | SqFt | LotSz | LP | SP | SP/SqFt | SP/LP | DIM | Score |
|---|---|---|---|---|---|---|---|---|---|---|---|---|---|
| 1355 Shadybrook Drive | Los Angeles | 1958 | 09/04/2026 | 3 | 4 | 2,860 | 14,896 | $3.67M | $3.80M | $1,329 | 1.03 | 42 | 74 |
| 1120 Maybrook Drive | Los Angeles | 1969 | 08/21/2026 | 4 | 3 | 3,278 | 11,646 | $4.50M | $4.45M | $1,358 | 0.99 | 45 | 72 |
| 1244 Shadybrook Drive | Beverly Hills | 1955 | 05/29/2026 | 4 | 4 | 3,207 | 16,742 | $4.50M | $4.33M | $1,349 | 0.96 | 70 | 72 |
| 1151 Angelo Drive | Beverly Hills | 1958 | 10/15/2026 | 4 | 3 | 3,225 | 7,871 | $4.50M | $4.50M | $1,395 | 1.00 | 67 | 69 |
| 1165 Coldwater Canyon Drive | Beverly Hills | 1948 | 10/29/2026 | 5 | 5 | 3,514 | 14,163 | $4.00M | $3.77M | $1,074 | 0.94 | 192 | 68 |
| Total: 5 · Average | 4.0 | 3.8 | 3,216.8 | 13,063.6 | $4.17M | $4.17M | $1,301 | — | 83.2 | ||||
| Median | 3,225 | $4.33M | $4.33M | ||||||||||
Market Analysis
List vs Sale $/SqFt
Sale Price Trend
Days on Market
Sale vs List Price
This analysis was generated automatically from MLS data. For an in-depth, human-reviewed valuation, contact Joseph Sardella at josephsardella@gmail.com.