1 / 2
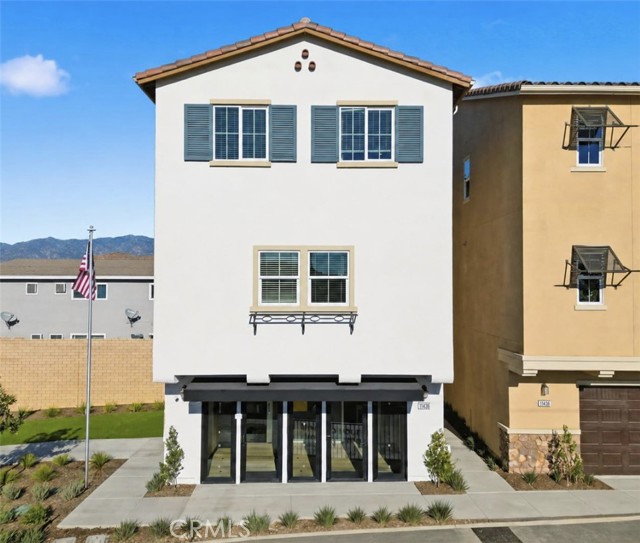
11415 Wildrose Lane, El Monte, CA 91731
$809K4bd · 4ba · 1,998 sqft
Lot 1,998 sqft•HOA $202/mo•Single Family Residence•Active•9d on market•MLS# WS-26229862
11415 Wildrose Lane, El Monte, CA 91731
MLS# WS-26229862•Residential•Single Family Residence
Active9 days on market
$808,880
4
Beds
4
Baths
1,998
Sq Ft
1,998
Lot Sq Ft
$202
HOA/mo
2026
Year Built
None
View
Property Description
Downstairs bedroom with full bath Walk-in kitchen pantry Expansive kitchen Dual-sink vanity at primary bath Upstairs laundry room Open floor plan
Features & Amenities
FeeBuilt 2026
Property Details
Land Type
Fee
Year Built
2026
Property Type
Residential
Property Subtype
Single Family Residence
Parking Spaces
2
Garage Spaces
2
Heating
Central, ENERGY STAR Qualified Equipment
Cooling
Central Air, Electric, ENERGY STAR Qualified Equipment, High Efficiency
View
None
Flooring
Vinyl, Carpet
City
El Monte
Zip Code
91731
County
Los Angeles
Mortgage Calculator
Current Rates
$
$
%
Monthly Payment
$4,090.14
Principal & Interest
Loan Amount
$647,104
Total Interest
$825,345
Total Payment Over 30 Years
$1,472,449
This calculator provides estimates only. Actual mortgage payments may include taxes, insurance, HOA fees, and PMI. Contact a lender for accurate quotes.
Comparative Market Analysis
Residential Tier · 5 active · 5 closed
11415 Wildrose Lane, El Monte, CA 91731
El Monte · Single Family Residence
$809K
Residential TierBeds
4
Baths
4
Sqft
1,998
Lot
1,998 sqft
Year
2026
$/Sqft
$405
Pool: No✓
Spa: No✓
View: None✓
Garage: 2-car✓
Listed 5.8% below the median closed sale of $858,536. Expect a longer timeline — comps averaged 170 days on market.
Price Position
Priced below the market — value advantage over the field.
Price advantage
Subject listed at $809K· $405/sqft
Total list price
Closed comps
vs closed median $859K
−$50K (−5.8%)
Active comps
vs active median $828K
−$19K (−2.3%)
Price per sqft
Closed compsinsufficient comp data
Active comps
vs active avg $/sqft $658
−$253 (−38.5%)
Active Properties (5)
Active Comparables
| Address | City | Year | BD | BTH | SqFt | LotSz | LP/SqFt | LP | DIM | Score |
|---|---|---|---|---|---|---|---|---|---|---|
| 4011 Cedar Avenue | El Monte | 1950 | 3 | 4 | 1,831 | 10,335 | $491 | $899,000 | 81 | 71 |
| 3829 Clark Avenue | El Monte | 1930 | 3 | 2 | 1,032 | 5,915 | $802 | $828,000 | 24 | 61 |
| 10966 Emery | El Monte | 1953 | 3 | 2 | 1,020 | 5,523 | $750 | $765,000 | 13 | 60 |
| 4951 Mcclintock Avenue | Temple City | 1953 | 4 | 3 | 1,451 | 5,699 | $606 | $879,999 | 561 | 60 |
| 4403 Cedar Ave | El Monte | 1920 | 3 | 1 | 1,134 | 4,991 | $643 | $729,000 | 89 | 55 |
| Total: 5 · Average | 3.2 | 2.4 | 1,293.6 | 6,492.6 | $658.4 | $820,199.8 | 153.6 | |||
| Median | 1,134 | $828,000 | ||||||||
Closed Properties (5)
Closed Comparables
| Address | City | Year | Date | BD | BTH | SqFt | LotSz | LP | SP | SP/SqFt | SP/LP | DIM | Score |
|---|---|---|---|---|---|---|---|---|---|---|---|---|---|
| 11454 Clover Lane | El Monte | 2026 | 08/21/2026 | 4 | 4 | 1,998 | 1,998 | $875,000 | $865,000 | $433 | 0.99 | 36 | 99 |
| 11448 Clover Lane | El Monte | 2026 | 08/20/2026 | 4 | 4 | 1,998 | 1,998 | $873,000 | $870,000 | $435 | 1.00 | 71 | 99 |
| 11450 Clover Lane | El Monte | 2026 | 08/20/2026 | 4 | 4 | 1,998 | 1,998 | $866,101 | $844,436 | $423 | 0.97 | 181 | 99 |
| 11442 Clover Lane | El Monte | 2026 | 09/29/2026 | 4 | 4 | 1,998 | 1,998 | $847,490 | $856,930 | $429 | 1.01 | 302 | 97 |
| 11444 Clover Lane | El Monte | 2026 | 09/30/2026 | 4 | 4 | 1,998 | 1,282 | $839,490 | $858,536 | $430 | 1.02 | 258 | 93 |
| Total: 5 · Average | 4.0 | 4.0 | 1,998 | 1,854.8 | $858,980.4 | $858,980.4 | $430 | — | 169.6 | ||||
| Median | 1,998 | $858,536 | $858,536 | ||||||||||
Market Analysis
List vs Sale $/SqFt
Sale Price Trend
Days on Market
Sale vs List Price
AI-generated CMA
This analysis was generated automatically from MLS data. For an in-depth, human-reviewed valuation, contact Joseph Sardella at josephsardella@gmail.com.