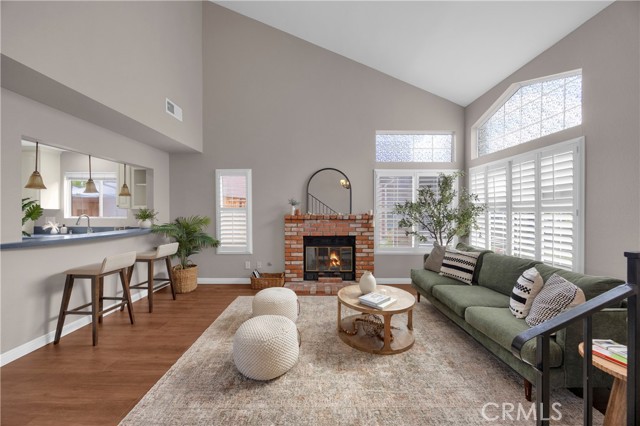
11270 Spitfire, San Diego, CA 92126
11270 Spitfire, San Diego, CA 92126
Property Description
Location, location, location! Welcome to 11270 Spitfire Rd in Mira Mesa. This move-in-ready home offers 4 bedrooms, 3 bathrooms, and approximately 1,822 square feet of living space. A downstairs bedroom and full bathroom provide flexibility for guests, a home office, or convenient main-level living. Enjoy easy access to freeways, markets, shopping, and dining. Comfort, flexibility, and everyday convenience—all in one place!
Features & Amenities
Property Details
Mortgage Calculator
Current Rates
About Mira Mesa
This property is located in Mira Mesa, a community in San Diego. Explore more listings in this neighborhood to compare options and pricing.
View Mira Mesa ListingsComparative Market Analysis
Residential Tier · 5 active · 5 closed
Mira Mesa · San Diego · Single Family Residence
Listed in line with the median closed sale of $1,175,000. Price per sqft ($656) is a 12% discount to closed comps ($745). Closed comps sold at 100% of list — strong seller's market.
Price Position
Aligned with the market — fair pricing for the comps.
Active Properties (5)
Active Comparables
| Address | City | Year | BD | BTH | SqFt | LotSz | LP/SqFt | LP | DIM | Score |
|---|---|---|---|---|---|---|---|---|---|---|
| 10472 Greenford Drive | San Diego | 1972 | 4 | 2 | 1,637 | 5,000 | $687 | $1.13M | 1 | 69 |
| 8243 Hydra Lane | San Diego | 1972 | 5 | 3 | 1,782 | 5,500 | $645 | $1.15M | 18 | 68 |
| 11843 Westview Parkway | San Diego | 2001 | 4 | 3 | 2,013 | 80,586 | $645 | $1.30M | 39 | 66 |
| 12738 Calle De Las Rosas | San Diego | 1985 | 3 | 3 | 1,683 | 6,981 | $790 | $1.33M | 46 | 65 |
| 11170 Briarcliff Drive | San Diego | 1980 | 4 | 2 | 1,744 | 7,841 | $737 | $1.28M | 54 | 65 |
| Total: 5 · Average | 4.0 | 2.6 | 1,771.8 | 21,181.6 | $700.8 | $1.24M | 31.6 | |||
| Median | 1,744 | $1.28M | ||||||||
Closed Properties (5)
Closed Comparables
| Address | City | Year | Date | BD | BTH | SqFt | LotSz | LP | SP | SP/SqFt | SP/LP | DIM | Score |
|---|---|---|---|---|---|---|---|---|---|---|---|---|---|
| 11129 Pegasus Ave. | San Diego | 1974 | 06/15/2026 | 5 | 4 | 2,255 | 5,100 | $1.29M | $1.33M | $590 | 1.03 | 37 | 84 |
| 9881 Dauntless Street | San Diego | 1985 | 05/04/2026 | 3 | 2 | 1,263 | 8,799 | $1.14M | $1.16M | $914 | 1.01 | 41 | 72 |
| 11095 Kite Hill Lane | San Diego | 1995 | 06/17/2026 | 5 | 3 | 2,259 | 6,569 | $1.40M | $1.35M | $598 | 0.96 | 58 | 69 |
| 9068 Kirby Court | San Diego | 1977 | 02/02/2026 | 4 | 2 | 1,366 | 5,227 | $1.17M | $1.18M | $860 | 1.00 | 48 | 69 |
| 11444 Elbert Way | San Diego | 1978 | 06/10/2026 | 3 | 2 | 1,502 | 8,500 | $1.15M | $1.15M | $765 | 1.00 | 61 | 64 |
| Total: 5 · Average | 4.0 | 2.6 | 1,729 | 6,839 | $1.23M | $1.23M | $745.4 | — | 49 | ||||
| Median | 1,502 | $1.18M | $1.18M | ||||||||||
Market Analysis
List vs Sale $/SqFt
Sale Price Trend
Days on Market
Sale vs List Price
This analysis was generated automatically from MLS data. For an in-depth, human-reviewed valuation, contact Joseph Sardella at josephsardella@gmail.com.