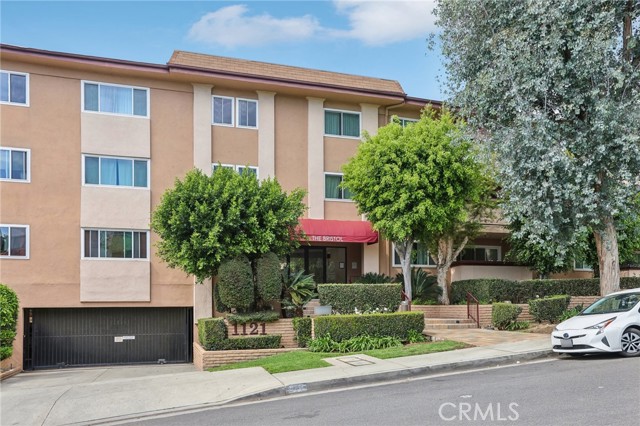
1121 North Olive Drive, 211, West Hollywood, CA 90069
1121 North Olive Drive, 211, West Hollywood, CA 90069
Property Description
Approved Short sale at 870,000.00. Experience modern luxury in the heart of West Hollywood with this stunning 2-bedroom, 2-bath condo, perfectly positioned amid the energy and excitement of Hollywood. Designed for both comfort and style, this contemporary residence features a deluxe modern kitchen, private bar, open-concept living spaces, a spacious primary suite, and an expansive outdoor balcony for seamless indoor-outdoor living. Enjoy the best of city life just outside your door, with premier nightlife, shopping, dining, and transportation all within easy reach. Welcome to 1211 Olive Dr, where sophisticated living meets the ultimate West Hollywood lifestyle.
Features & Amenities
Property Details
Mortgage Calculator
Current Rates
Comparative Market Analysis
Affordable Tier · 5 active · 5 closed
West Hollywood · Condominium
Listed in line with the median closed sale of $885,000.
Price Position
Aligned with the market — fair pricing for the comps.
Active Properties (5)
Active Comparables
| Address | City | Year | BD | BTH | SqFt | LotSz | LP/SqFt | LP | DIM | Score |
|---|---|---|---|---|---|---|---|---|---|---|
| 1121 Olive Drive | West Hollywood | 1970 | 2 | 2 | 1,379 | 31,315 | $652 | $899,000 | 81 | 93 |
| 1121 Olive Drive | West Hollywood | 1970 | 2 | 2 | 1,258 | 31,315 | $711 | $895,000 | 31 | 92 |
| 8380 Waring Avenue | West Hollywood | 1973 | 2 | 2 | 1,372 | 24,039 | $579 | $795,000 | 8 | 91 |
| 1221 Kings Road | West Hollywood | 1969 | 2 | 2 | 1,181 | 29,005 | $804 | $949,000 | 34 | 89 |
| 8401 Fountain Avenue | West Hollywood | 1961 | 2 | 2 | 1,423 | 9,000 | $597 | $849,000 | 3 | 88 |
| Total: 5 · Average | 2.0 | 2.0 | 1,322.6 | 24,934.8 | $668.6 | $877,400 | 31.4 | |||
| Median | 1,372 | $895,000 | ||||||||
Closed Properties (5)
Closed Comparables
| Address | City | Year | Date | BD | BTH | SqFt | LotSz | LP | SP | SP/SqFt | SP/LP | DIM | Score |
|---|---|---|---|---|---|---|---|---|---|---|---|---|---|
| 8455 Fountain Avenue | West Hollywood | 1975 | 10/26/2026 | 2 | 2 | 1,346 | 85,412 | $948,000 | $885,000 | $658 | 0.93 | 97 | 89 |
| 8530 HOLLOWAY Drive | West Hollywood | 1973 | 07/02/2026 | 2 | 2 | 1,306 | 47,398 | $899,000 | $865,000 | $662 | 0.96 | 63 | 88 |
| 1100 Alta Loma Road | West Hollywood | 1964 | 08/28/2026 | 2 | 2 | 1,607 | 44,427 | $998,000 | $998,000 | $621 | 1.00 | 37 | 88 |
| 8455 Fountain Avenue | West Hollywood | 1975 | 08/27/2026 | 2 | 2 | 1,646 | 85,412 | $985,000 | $940,000 | $571 | 0.95 | 35 | 87 |
| 8400 De Longpre Avenue | West Hollywood | 1973 | 08/19/2026 | 2 | 2 | 1,059 | 30,315 | $748,000 | $754,000 | $712 | 1.01 | 76 | 87 |
| Total: 5 · Average | 2.0 | 2.0 | 1,392.8 | 58,592.8 | $888,400 | $888,400 | $644.8 | — | 61.6 | ||||
| Median | 1,346 | $885,000 | $885,000 | ||||||||||
Market Analysis
List vs Sale $/SqFt
Sale Price Trend
Days on Market
Sale vs List Price
This analysis was generated automatically from MLS data. For an in-depth, human-reviewed valuation, contact Joseph Sardella at josephsardella@gmail.com.