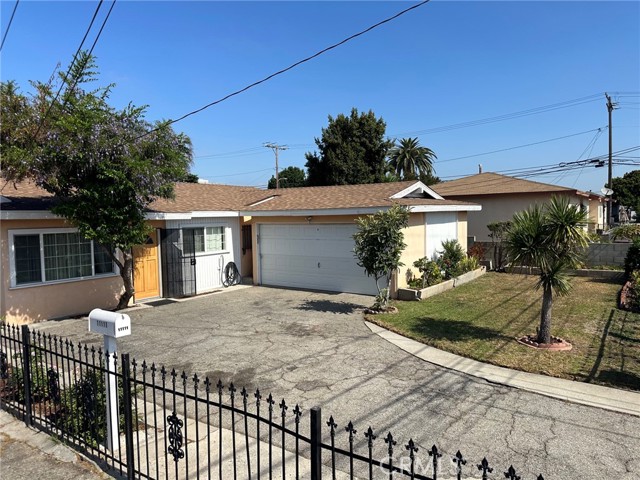
11111 South Osage, Inglewood, CA 90304
11111 South Osage, Inglewood, CA 90304
Property Description
Location, Lifestyle & Opportunity! Welcome home to this inviting 4-bedroom, 2-bath residence featuring an attached two-car garage, indoor laundry, spacious tiled living areas, and a sun-filled bonus room overlooking a private backyard. Whether you’re hosting family gatherings or enjoying a quiet evening at home, this property offers the perfect blend of comfort and functionality. Nestled in a prime location just minutes from LAX, SpaceX, SoFi Stadium, Intuit Dome, the South Bay beaches, shopping, dining, and entertainment, you’ll enjoy quick access to some of Southern California’s most exciting destinations while still having a place to call home. This is an excellent opportunity for owner-occupants or investors looking to own in a highly desirable, centrally located neighborhood.
Features & Amenities
Property Details
Mortgage Calculator
Current Rates
Comparative Market Analysis
Affordable Tier · 5 active · 5 closed
Inglewood · Single Family Residence
Listed 5.1% below the median closed sale of $785,000. Price per sqft ($553) is a 18% discount to closed comps ($675). Closed comps sold at 102% of list — strong seller's market.
Price Position
Priced below the market — value advantage over the field.
Active Properties (5)
Active Comparables
| Address | City | Year | BD | BTH | SqFt | LotSz | LP/SqFt | LP | DIM | Score |
|---|---|---|---|---|---|---|---|---|---|---|
| 3612 113th | Inglewood | 1942 | 3 | 2 | 1,370 | 6,029 | $577 | $790,000 | 73 | 83 |
| 4134 107th | Inglewood | 1925 | 3 | 2 | 1,143 | 4,166 | $661 | $755,000 | 66 | 80 |
| 11125 Osage Avenue | Inglewood | 1922 | 3 | 2 | 1,441 | 7,293 | $554 | $799,000 | 123 | 80 |
| 3735 117th | Hawthorne | 1940 | 3 | 1 | 1,157 | 7,572 | $605 | $699,999 | 6 | 76 |
| 3855 115th | Hawthorne | 1924 | 2 | 1 | 936 | 5,998 | $854 | $799,000 | 1 | 72 |
| Total: 5 · Average | 2.8 | 1.6 | 1,209.4 | 6,211.6 | $650.2 | $768,599.8 | 53.8 | |||
| Median | 1,157 | $790,000 | ||||||||
Closed Properties (5)
Closed Comparables
| Address | City | Year | Date | BD | BTH | SqFt | LotSz | LP | SP | SP/SqFt | SP/LP | DIM | Score |
|---|---|---|---|---|---|---|---|---|---|---|---|---|---|
| 3841 113TH | Inglewood | 1978 | 04/03/2026 | 3 | 2 | 1,450 | 6,020 | $725,000 | $720,000 | $497 | 0.99 | 79 | 84 |
| 4115 111th Street | Inglewood | 1927 | 12/29/2025 | 3 | 2 | 1,411 | 6,045 | $819,000 | $820,000 | $581 | 1.00 | 85 | 79 |
| 10917 Osage Avenue | Inglewood | 1950 | 08/07/2026 | 3 | 1 | 1,190 | 9,926 | $699,000 | $785,000 | $660 | 1.12 | 44 | 77 |
| 3848 112th | Inglewood | 1947 | 12/05/2025 | 3 | 3 | 1,467 | 5,423 | $770,000 | $770,000 | $525 | 1.00 | 50 | 76 |
| 3907 109th Street | Inglewood | 1923 | 07/27/2026 | 3 | 1 | 766 | 9,030 | $850,000 | $850,000 | $1,110 | 1.00 | 146 | 66 |
| Total: 5 · Average | 3.0 | 1.8 | 1,256.8 | 7,288.8 | $789,000 | $789,000 | $674.6 | — | 80.8 | ||||
| Median | 1,411 | $785,000 | $785,000 | ||||||||||
Market Analysis
List vs Sale $/SqFt
Sale Price Trend
Days on Market
Sale vs List Price
This analysis was generated automatically from MLS data. For an in-depth, human-reviewed valuation, contact Joseph Sardella at josephsardella@gmail.com.