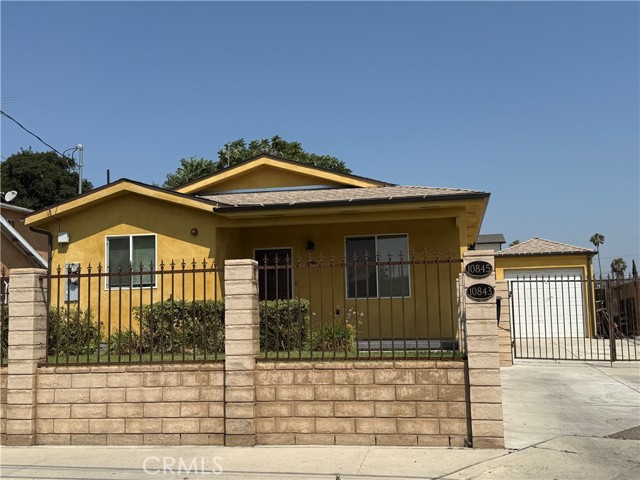
10845 Vinedale Street, Sun Valley, CA 91352
10845 Vinedale Street, Sun Valley, CA 91352
Property Description
TWO BEAUTIFUL HOUSES, TWO PROPERTIES IN THE SAME LOT! HOUSES HAS BEEN BUILD IN 2019 EACH PROPERTY FEATURE 3 BEDROOMS AND 2 BATHROOMS, HIGH CEILINGS, AC UNIT, LAUNDRY ROOM, DONT WAIT THIS HOUSE IS FOR YOU! PERFECT TO LIVE IN ONE PROPERTY AND RENT THE OTHER ONE, ALSO HAVE A DETACHED GARAGE THAT YOU CAN EASILY MAKE AN EXTRA LIVING UNIT TO RENT. CALL ME FOR A PRIVATE SHOWING.
Features & Amenities
Property Details
Mortgage Calculator
Current Rates
Comparative Market Analysis
Residential Tier · 5 active · 5 closed
Sun Valley · Single Family Residence
Listed in line with the median closed sale of $1,205,000. Price per sqft ($508) is a 20% discount to closed comps ($633). Closed comps sold at 104% of list — strong seller's market.
Price Position
Aligned with the market — fair pricing for the comps.
Active Properties (5)
Active Comparables
| Address | City | Year | BD | BTH | SqFt | LotSz | LP/SqFt | LP | DIM | Score |
|---|---|---|---|---|---|---|---|---|---|---|
| 10957 Crockett | Sun Valley | 1953 | 5 | 4 | 1,880 | 8,021 | $638 | $1.20M | 4 | 82 |
| 8535 Norris | Sun Valley | 2005 | 5 | 3 | 2,464 | 6,413 | $487 | $1.20M | 47 | 82 |
| 7822 Ferncola Avenue | Sun Valley | 1939 | 6 | 4 | 1,950 | 5,544 | $538 | $1.05M | 3 | 79 |
| 11853 Cantara Street | Los Angeles | 1953 | 5 | 4 | 2,411 | 8,124 | $537 | $1.29M | 52 | 76 |
| 8369 Vine Valley | Sun Valley | 1950 | 3 | 2 | 1,833 | 6,053 | $753 | $1.38M | 27 | 71 |
| Total: 5 · Average | 4.8 | 3.4 | 2,107.6 | 6,831 | $590.6 | $1.22M | 26.6 | |||
| Median | 1,950 | $1.20M | ||||||||
Closed Properties (5)
Closed Comparables
| Address | City | Year | Date | BD | BTH | SqFt | LotSz | LP | SP | SP/SqFt | SP/LP | DIM | Score |
|---|---|---|---|---|---|---|---|---|---|---|---|---|---|
| 10823 Cantara Street | Sun Valley | 1945 | 05/12/2026 | 5 | 4 | 2,349 | 6,423 | $999,000 | $1.02M | $436 | 1.03 | 41 | 85 |
| 8321 Outland View | Sun Valley | 1950 | 06/02/2026 | 3 | 4 | 1,789 | 6,054 | $1.30M | $1.28M | $717 | 0.99 | 89 | 71 |
| 10636 Nettleton Street | Sun Valley | 1954 | 07/29/2026 | 4 | 3 | 1,424 | 9,605 | $995,000 | $1.05M | $737 | 1.05 | 48 | 71 |
| 8407 Broadacre Drive | Sun Valley | 1956 | 08/12/2026 | 3 | 2 | 1,497 | 6,573 | $1.10M | $1.21M | $805 | 1.10 | 36 | 64 |
| 10538 Ormond | Sunland | 1965 | 07/29/2026 | 4 | 4 | 2,900 | 56,460 | $1.30M | $1.37M | $472 | 1.05 | 40 | 62 |
| Total: 5 · Average | 3.8 | 3.4 | 1,991.8 | 17,023 | $1.19M | $1.19M | $633.4 | — | 50.8 | ||||
| Median | 1,789 | $1.21M | $1.21M | ||||||||||
Market Analysis
List vs Sale $/SqFt
Sale Price Trend
Days on Market
Sale vs List Price
This analysis was generated automatically from MLS data. For an in-depth, human-reviewed valuation, contact Joseph Sardella at josephsardella@gmail.com.