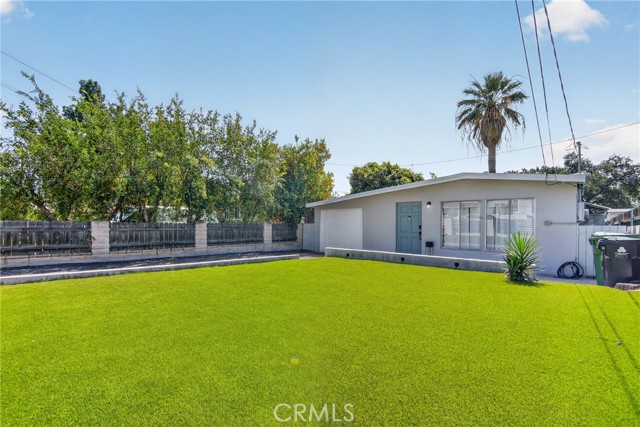
10831 Odell Avenue, Sunland, CA 91040
10831 Odell Avenue, Sunland, CA 91040
Property Description
Welcome home — a sun-drenched 1948 Mid-Century charmer tucked into the Sunland foothills and priced to be the most affordable detached home story you'll tell this year. Inside, original wood-beamed ceilings, hardwood-style flooring, and oversized windows pour natural light across an open living and dining flow. French doors swing open to a private outdoor patio — quintessential California indoor-outdoor living for morning coffee, weekend BBQs, or stargazing under the San Gabriels. Two true bedrooms, a clean full bath, and a converted 1-car garage that works beautifully as a third bedroom, home office, creative studio, or future ADU. Step outside and you're minutes from Angeles National Forest trails, Oro Vista Park, Tujunga Ponds Wildlife Sanctuary, and the cafés, taquerias, and antique shops of Foothill Blvd. Quick I-210 access puts Burbank studios, Glendale, Pasadena, and Downtown LA within an easy commute. Zoned for Apperson Street Elementary, Mount Gleason Middle, and Verdugo Hills High. Don't miss this one.
Features & Amenities
Property Details
Mortgage Calculator
Current Rates
Comparative Market Analysis
Affordable Tier · 4 active · 5 closed
Sunland · Single Family Residence
Listed 6.6% below the median closed sale of $685,000. Price per sqft ($758) is a 25% premium to closed comps ($605). Closed comps sold at 89% of list — buyers have negotiating leverage.
Price Position
Priced below the market — value advantage over the field.
Active Properties (4)
Active Comparables
| Address | City | Year | BD | BTH | SqFt | LotSz | LP/SqFt | LP | DIM | Score |
|---|---|---|---|---|---|---|---|---|---|---|
| 7663 Airlie Drive | Tujunga | 1959 | 2 | 1 | 846 | 5,007 | $857 | $725,000 | 18 | 83 |
| 10626 Olive Grove Avenue | Sunland | 1954 | 3 | 2 | 1,157 | 3,913 | $588 | $679,900 | 23 | 76 |
| 7050 Shadygrove | Tujunga | 1923 | 1 | 1 | 751 | 4,122 | $798 | $599,000 | 19 | 65 |
| 10015 Marcus | Tujunga | 1947 | 3 | 2 | 554 | 3,230 | $1,137 | $629,900 | 225 | 64 |
| Total: 4 · Average | 2.3 | 1.5 | 827 | 4,068 | $845 | $658,450 | 71.25 | |||
| Median | 846 | $679,900 | ||||||||
Closed Properties (5)
Closed Comparables
| Address | City | Year | Date | BD | BTH | SqFt | LotSz | LP | SP | SP/SqFt | SP/LP | DIM | Score |
|---|---|---|---|---|---|---|---|---|---|---|---|---|---|
| 8230 Hillrose Street | Sunland | 1954 | 11/18/2025 | 2 | 1 | 1,007 | 3,714 | $610,000 | $590,000 | $586 | 0.97 | 102 | 82 |
| 8254 Oswego Street | Sunland | 1947 | 10/13/2026 | 2 | 2 | 1,016 | 6,720 | $999,000 | $665,000 | $655 | 0.67 | 19 | 81 |
| 8228 Wentworth Street | Sunland | 1940 | 08/05/2026 | 2 | 1 | 1,216 | 7,216 | $699,000 | $685,000 | $563 | 0.98 | 84 | 76 |
| 7832 Forsythe Street | Sunland | 1940 | 09/17/2026 | 3 | 2 | 1,348 | 3,733 | $800,000 | $690,000 | $512 | 0.86 | 21 | 73 |
| 8444 Grenoble Street | Los Angeles | 1977 | 07/07/2026 | 3 | 2 | 1,040 | 6,064 | $750,000 | $735,000 | $707 | 0.98 | 180 | 73 |
| Total: 5 · Average | 2.4 | 1.6 | 1,125.4 | 5,489.4 | $673,000 | $673,000 | $604.6 | — | 81.2 | ||||
| Median | 1,040 | $685,000 | $685,000 | ||||||||||
Market Analysis
List vs Sale $/SqFt
Sale Price Trend
Days on Market
Sale vs List Price
This analysis was generated automatically from MLS data. For an in-depth, human-reviewed valuation, contact Joseph Sardella at josephsardella@gmail.com.