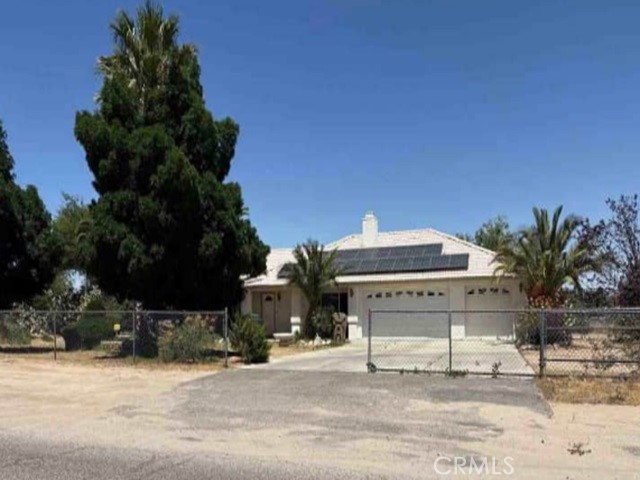
10695 5th Avenue, Hesperia, CA 92345
10695 5th Avenue, Hesperia, CA 92345
Property Description
Welcome to Hesperia CA. Local attractions in area include Hesperia Zoo and Hesperia Lake. This home was built in 1999 and sits on a good size lot of 68,800 sq. ft. The home has 2,144 sq. ft. and it includes a two-car garage. Buyer will be responsible for either paying on any solar panel lien or assuming the solar lease if possible. Buyers check City, County, Zoning, Tax, and other records to their satisfaction. AS-IS SALE property.
Features & Amenities
Property Details
Mortgage Calculator
Current Rates
Comparative Market Analysis
Residential Tier · 5 active · 5 closed
Hesperia · Single Family Residence
Listed 10.1% above the median closed sale of $480,000. Price per sqft ($247) is a 16% discount to closed comps ($293).
Price Position
Positioned above the market — commands a premium.
Active Properties (5)
Active Comparables
| Address | City | Year | BD | BTH | SqFt | LotSz | LP/SqFt | LP | DIM | Score |
|---|---|---|---|---|---|---|---|---|---|---|
| 10839 11th Avenue | Hesperia | 1988 | 3 | 2 | 1,982 | 47,480 | $232 | $459,999 | 73 | 79 |
| 10609 8th Avenue | Hesperia | 1980 | 4 | 2 | 2,200 | 45,900 | $227 | $499,000 | 26 | 78 |
| 15921 Pine Street | Hesperia | 2007 | 4 | 3 | 2,260 | 22,500 | $221 | $499,999 | 79 | 77 |
| 15939 Mojave | Hesperia | 1980 | 4 | 2 | 1,440 | 47,350 | $319 | $460,000 | 135 | 74 |
| 16326 Eucalyptus Street | Hesperia | 1983 | 4 | 2 | 2,344 | 43,560 | $220 | $515,000 | 30 | 73 |
| Total: 5 · Average | 3.8 | 2.2 | 2,045.2 | 41,358 | $243.8 | $486,799.6 | 68.6 | |||
| Median | 2,200 | $499,000 | ||||||||
Closed Properties (5)
Closed Comparables
| Address | City | Year | Date | BD | BTH | SqFt | LotSz | LP | SP | SP/SqFt | SP/LP | DIM | Score |
|---|---|---|---|---|---|---|---|---|---|---|---|---|---|
| 10658 9th Avenue | Hesperia | 1989 | 10/28/2026 | 3 | 3 | 1,985 | 43,560 | $485,000 | $460,000 | $232 | 0.95 | 133 | 83 |
| 10438 7th | Hesperia | 2018 | 05/13/2026 | 4 | 3 | 2,268 | 46,459 | $589,000 | $580,000 | $256 | 0.98 | 58 | 82 |
| 16424 Verde St | Hesperia | 1987 | 07/30/2026 | 3 | 2 | 1,214 | 74,923 | $460,000 | $460,000 | $379 | 1.00 | 53 | 78 |
| 10655 9th | Hesperia | 1987 | 09/29/2026 | 3 | 2 | 1,540 | 43,995 | $479,900 | $480,000 | $312 | 1.00 | 47 | 77 |
| 11441 5th Ave | Hesperia | 2026 | 08/12/2026 | 4 | 3 | 2,115 | 44,431 | $609,000 | $600,000 | $284 | 0.98 | 61 | 73 |
| Total: 5 · Average | 3.4 | 2.6 | 1,824.4 | 50,673.6 | $516,000 | $516,000 | $292.6 | — | 70.4 | ||||
| Median | 1,985 | $480,000 | $480,000 | ||||||||||
Market Analysis
List vs Sale $/SqFt
Sale Price Trend
Days on Market
Sale vs List Price
This analysis was generated automatically from MLS data. For an in-depth, human-reviewed valuation, contact Joseph Sardella at josephsardella@gmail.com.