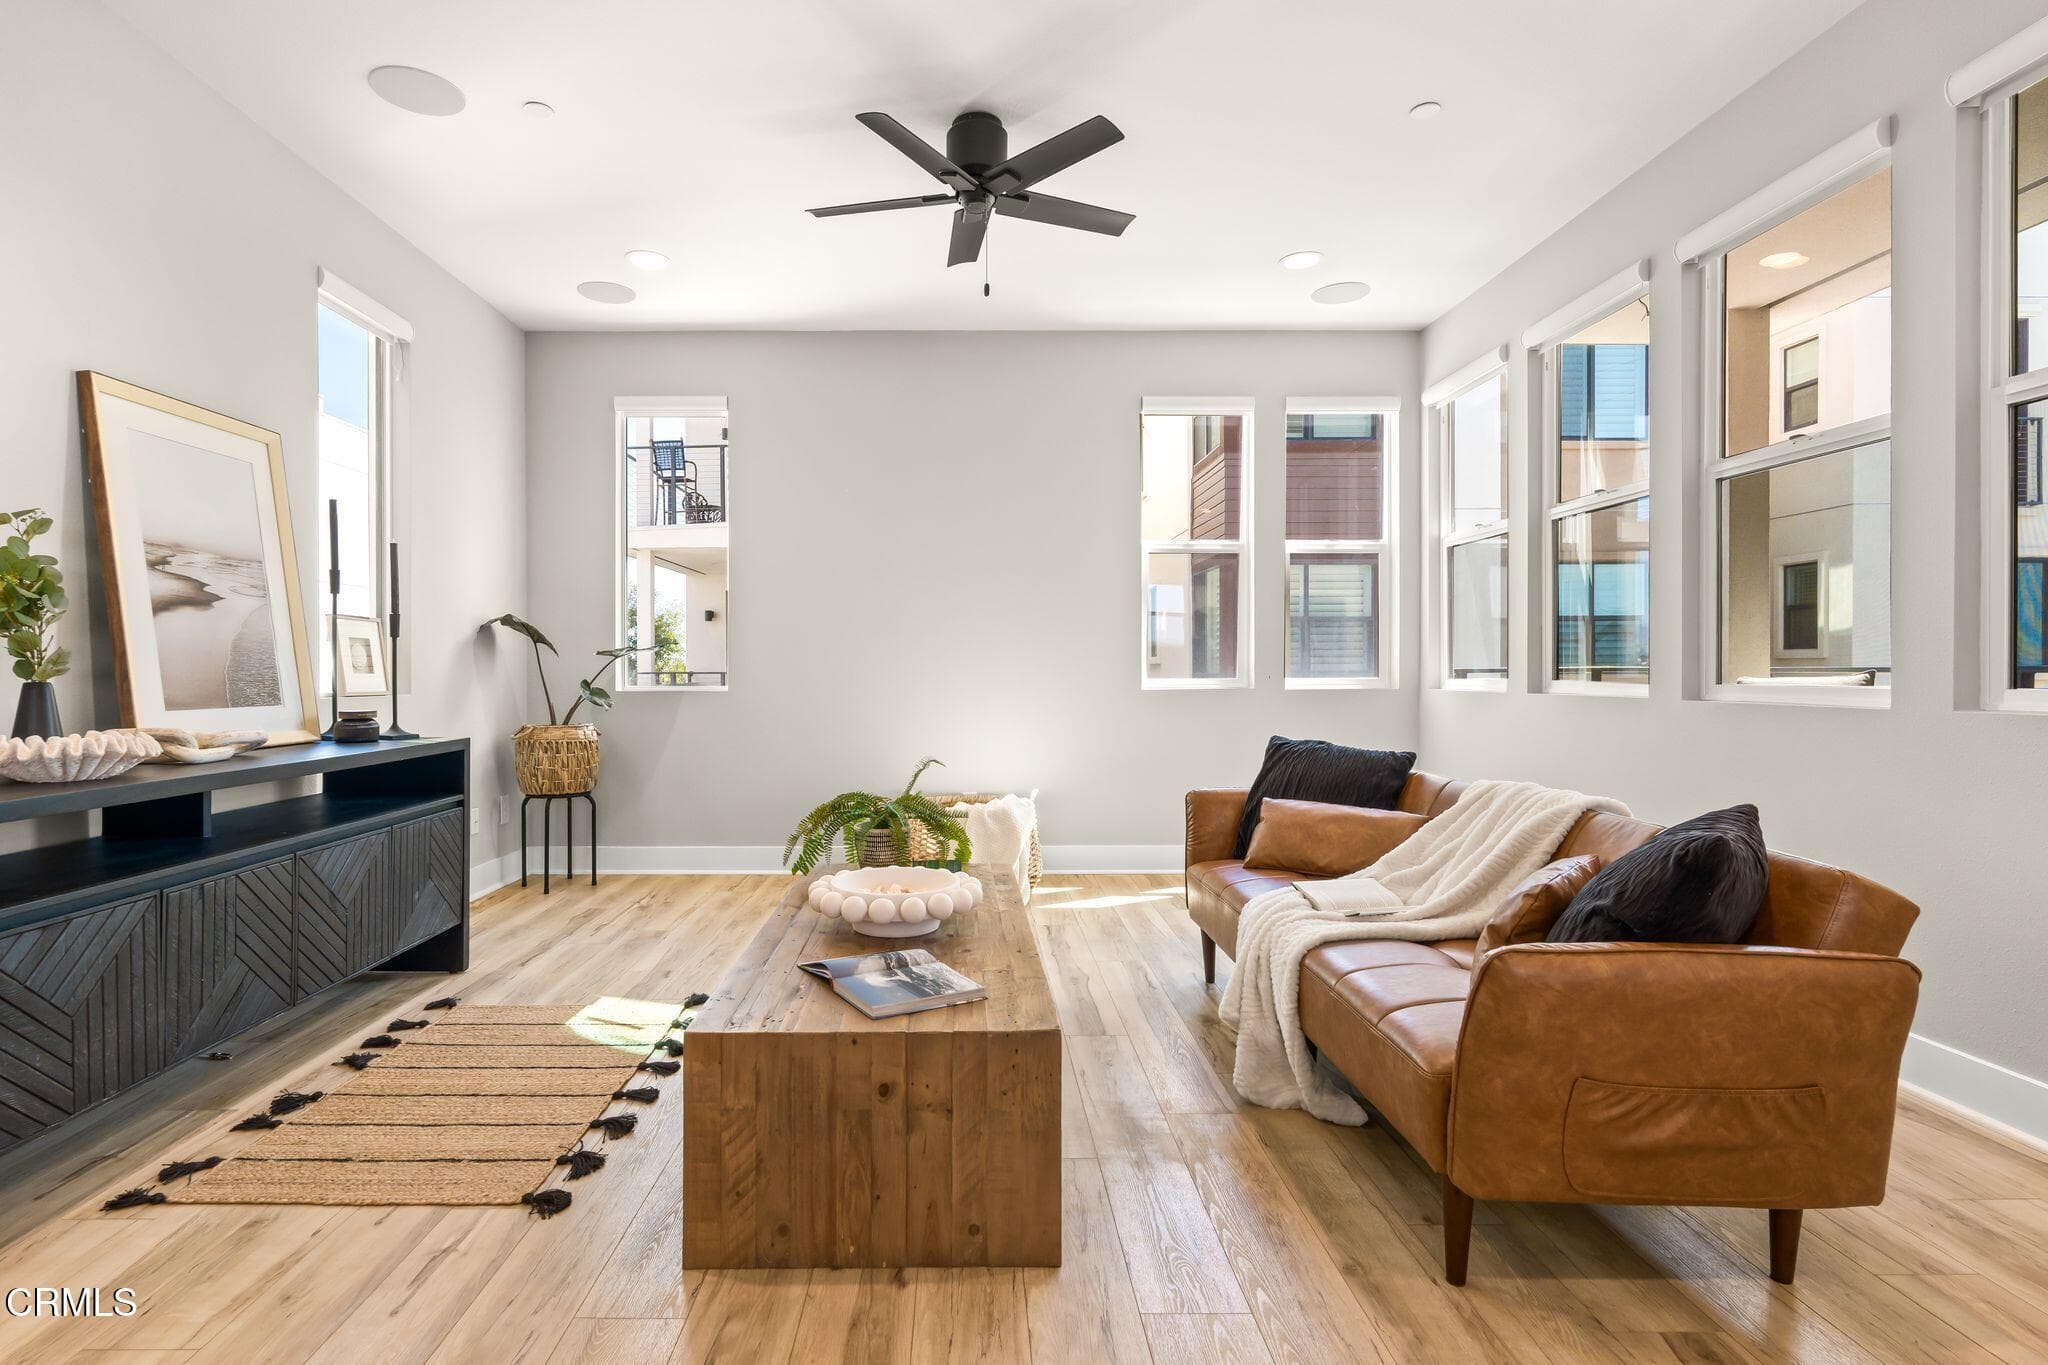
1066 Canal Street, Oxnard, CA 93035
1066 Canal Street, Oxnard, CA 93035
Property Description
Experience the best of coastal living in the desirable Shoreline 50 community! Enjoy panoramic water views from the rooftop patio, main living area, and private primary-suite balcony. This highly upgraded home features wood flooring throughout, central A/C, motorized window shades, and built-in surround sound. Each bedroom features its own en-suite bathroom, including a convenient first-floor bedroom--perfect for guests, multigenerational living, or a private home office. The private backyard is ideal for entertaining, complete with a built-in fire pit, turf, and lounge area. Additional highlights include a two-car garage and access to the community pool, spa, and clubhouse. Perfect for beach and outdoor enthusiasts, this home is just a short walk from the upcoming North Shore development, offering easy access to new canal trails, park spaces, and scenic coastal pathways. Enjoy the relaxed beach lifestyle while still being close to everything!
Features & Amenities
Property Details
Mortgage Calculator
Current Rates
Comparative Market Analysis
Residential Tier · 5 active · 5 closed
Oxnard · Single Family Residence
Listed 13.8% above the median closed sale of $923,000. Price per sqft ($526) is a 13% premium to closed comps ($465).
Price Position
Positioned above the market — commands a premium.
Active Properties (5)
Active Comparables
| Address | City | Year | BD | BTH | SqFt | LotSz | LP/SqFt | LP | DIM | Score |
|---|---|---|---|---|---|---|---|---|---|---|
| 1087 Canal Street | Oxnard | 2021 | 3 | 4 | 1,996 | 1,314 | $498 | $995,000 | 68 | 95 |
| 3001 Naples Drive | Oxnard | 2005 | 4 | 3 | 1,846 | 4,356 | $487 | $899,000 | 187 | 62 |
| 1440 Helm Drive | Oxnard | 1980 | 4 | 3 | 1,852 | 6,098 | $485 | $899,000 | 16 | 59 |
| 708 Binnacle Street | Oxnard | 1997 | 4 | 2 | 2,133 | 6,098 | $450 | $959,000 | 54 | 57 |
| 1977 El Cajon Circle | Oxnard | 1986 | 4 | 3 | 1,766 | 13,068 | $583 | $1.03M | 78 | 56 |
| Total: 5 · Average | 3.8 | 3.0 | 1,918.6 | 6,186.8 | $500.6 | $956,400 | 80.6 | |||
| Median | 1,852 | $959,000 | ||||||||
Closed Properties (5)
Closed Comparables
| Address | City | Year | Date | BD | BTH | SqFt | LotSz | LP | SP | SP/SqFt | SP/LP | DIM | Score |
|---|---|---|---|---|---|---|---|---|---|---|---|---|---|
| 1095 Canal Street | Oxnard | 2021 | 05/14/2026 | 3 | 4 | 2,232 | 1,536 | $1.09M | $1.11M | $500 | 1.02 | 129 | 91 |
| 2920 Naples Drive | Oxnard | 2005 | 01/06/2026 | 3 | 2 | 1,910 | 0 | $920,000 | $900,000 | $471 | 0.98 | 54 | 66 |
| 740 Freeport Lane | Oxnard | 2005 | 06/04/2026 | 4 | 4 | 2,422 | 3,920 | $1.02M | $950,000 | $392 | 0.93 | 59 | 61 |
| 3514 Dunkirk Drive | Oxnard | 2006 | 12/19/2025 | 3 | 2 | 1,910 | 5,662 | $920,000 | $923,000 | $483 | 1.00 | 60 | 60 |
| 2520 Oarfish Lane | Oxnard | 1981 | 08/17/2026 | 4 | 3 | 1,913 | 6,969 | $920,000 | $920,000 | $481 | 1.00 | 32 | 60 |
| Total: 5 · Average | 3.4 | 3.0 | 2,077.4 | 4,521.75 | $961,600 | $961,600 | $465.4 | — | 66.8 | ||||
| Median | 1,913 | $923,000 | $923,000 | ||||||||||
Market Analysis
List vs Sale $/SqFt
Sale Price Trend
Days on Market
Sale vs List Price
This analysis was generated automatically from MLS data. For an in-depth, human-reviewed valuation, contact Joseph Sardella at josephsardella@gmail.com.