1054 East Overlook Drive, Orange, CA 92867
1054 East Overlook Drive, Orange, CA 92867
Property Description
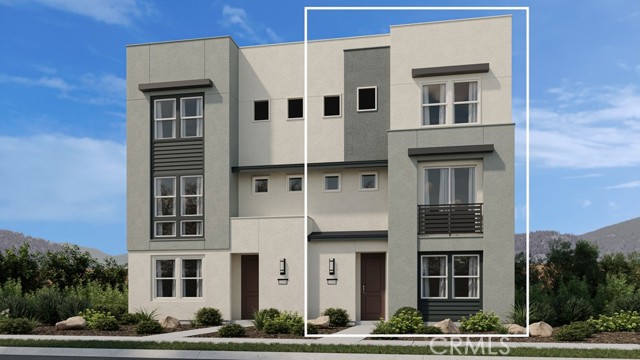
What's Special: Flex Room | Spacious Kitchen | No Rear Neighbors | Backs to Amenity. New Construction – November Completion! Built by America's Most Trusted Home Builder. Welcome to the Plan 1 at 1054 E Overlook Drive at Viewpoint at Katella! The first floor features a versatile flex room and spacious two-car garage. On the second level, the bright great room flows seamlessly into the dining area and kitchen, showcasing quartz countertops, a large island, and walk-in pantry. The third floor is dedicated to relaxation, with a private primary suite featuring a walk-in closet and en-suite bath, plus two secondary bedrooms and a full bathroom. Laminate flooring extends throughout, including the stairs, for a stylish and cohesive finish. Viewpoint on Katella offers modern living in a prime Anaheim location, just moments from the Honda Center, Angel Stadium, Disneyland, and premier shopping and dining. Enjoy concerts, baseball games, and local breweries in the vibrant Platinum Triangle. Convenient access to John Wayne Airport, the Anaheim Regional Transportation Center, and the 55 Freeway makes commuting simple. Nearby schools include California Inspire Academy, Yorba Middle School, and Orange High School. Community amenities like a dog park and playscape add to the lifestyle appeal. Additional Highlights Include: Matte black hardware throughout, motion sense kitchen faucet, and recessed lighting in primary and great room. Photos are for representative purposes only. MLS#IG26191172
Features & Amenities
Property Details
Mortgage Calculator
Current Rates
Comparative Market Analysis
Residential Tier · 5 active · 5 closed
Orange · Single Family Residence
Listed 9.1% below the median closed sale of $1,199,000. Price per sqft ($571) is a 12% discount to closed comps ($646). Closed comps sold at 101% of list — strong seller's market.
Price Position
Priced below the market — value advantage over the field.
Active Properties (5)
Active Comparables
| Address | City | Year | BD | BTH | SqFt | LotSz | LP/SqFt | LP | DIM | Score |
|---|---|---|---|---|---|---|---|---|---|---|
| 1072 Overlook Drive | Orange | 2026 | 3 | 3 | 1,950 | 1,623 | $513 | $999,990 | 61 | 99 |
| 1021 Overlook Drive | Orange | 2026 | 3 | 3 | 1,584 | 1,750 | $694 | $1.10M | 39 | 92 |
| 805 Barkley Avenue | Orange | 1967 | 3 | 3 | 1,953 | 6,030 | $604 | $1.18M | 50 | 75 |
| 1087 Greengrove | Orange | 1962 | 4 | 2 | 1,469 | 8,460 | $715 | $1.05M | 36 | 69 |
| 1323 Mayfair | Orange | 1955 | 3 | 2 | 1,800 | 6,960 | $681 | $1.23M | 32 | 62 |
| Total: 5 · Average | 3.2 | 2.6 | 1,751.2 | 4,964.6 | $641.4 | $1.11M | 43.6 | |||
| Median | 1,800 | $1.10M | ||||||||
Closed Properties (5)
Closed Comparables
| Address | City | Year | Date | BD | BTH | SqFt | LotSz | LP | SP | SP/SqFt | SP/LP | DIM | Score |
|---|---|---|---|---|---|---|---|---|---|---|---|---|---|
| 1220 Adams Avenue | Orange | 1964 | 07/22/2026 | 3 | 2 | 1,853 | 8,400 | $1.23M | $1.23M | $661 | 1.00 | 28 | 75 |
| 402 Hoover Avenue | Orange | 1963 | 07/08/2026 | 3 | 3 | 1,716 | 8,016 | $1.15M | $1.25M | $729 | 1.09 | 26 | 75 |
| 515 Hoover | Orange | 1959 | 08/24/2026 | 4 | 2 | 2,042 | 7,106 | $1.20M | $1.20M | $587 | 1.00 | 28 | 73 |
| 315 Wilson | Orange | 1958 | 08/10/2026 | 4 | 3 | 1,636 | 6,771 | $1.15M | $1.10M | $672 | 0.96 | 90 | 72 |
| 1232 Chestnut Avenue | Orange | 1962 | 11/10/2025 | 3 | 2 | 1,851 | 7,361 | $1.07M | $1.07M | $581 | 1.00 | 83 | 71 |
| Total: 5 · Average | 3.4 | 2.4 | 1,819.6 | 7,530.8 | $1.17M | $1.17M | $646 | — | 51 | ||||
| Median | 1,851 | $1.20M | $1.20M | ||||||||||
Market Analysis
List vs Sale $/SqFt
Sale Price Trend
Days on Market
Sale vs List Price
This analysis was generated automatically from MLS data. For an in-depth, human-reviewed valuation, contact Joseph Sardella at josephsardella@gmail.com.