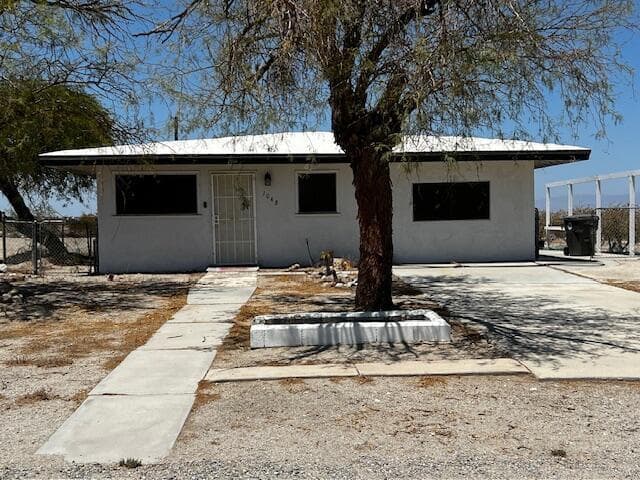
1048 Sea Raider Avenue, Thermal, CA 92274
1048 Sea Raider Avenue, Thermal, CA 92274
Property Description
Charming & Affordable Home Near the Salton Sea Marina Discover this charming and affordably priced home in the Thermal area, conveniently located near the Salton Sea Marina. Offering 3 bedrooms, 1 bathroom, and 896 square feet of comfortable living space, this home is a fantastic opportunity for first-time buyers, investors, or anyone looking for an affordable desert retreat. This home features a brand-new kitchen and new flooring throughout, giving it a fresh, modern feel that's ready for you to enjoy. It's also conveniently located near an elementary school, making it a great option for families. Enjoy a functional floor plan, plenty of potential to make it your own, and a convenient location with easy access to nearby amenities and recreational activities. Don't miss out on this great value! Call us today to schedule your private showing and see everything this home has to offer.
Features & Amenities
Property Details
Mortgage Calculator
Current Rates
Comparative Market Analysis
Affordable Tier · 5 active · 5 closed
Not Applicable · Thermal · Single Family Residence
Listed 6.4% above the median closed sale of $249,000. Price per sqft ($296) is a 47% premium to closed comps ($202).
Price Position
Positioned above the market — commands a premium.
Active Properties (5)
Active Comparables
| Address | City | Year | BD | BTH | SqFt | LotSz | LP/SqFt | LP | DIM | Score |
|---|---|---|---|---|---|---|---|---|---|---|
| 1251 Huntington Avenue | Thermal | 1984 | 2 | 2 | 1,056 | 10,034 | $251 | $265,000 | 120 | 74 |
| 2502 Harbor Drive | Thermal | 1958 | 4 | 2 | 1,400 | 10,317 | $164 | $230,000 | 67 | 68 |
| 2668 Desert Drive | Thermal | 2006 | 3 | 2 | 1,282 | 9,652 | $234 | $300,000 | 45 | 66 |
| 944 Flamingo Avenue | Salton City | 1976 | 3 | 2 | 1,600 | 34,848 | $172 | $274,900 | 20 | 63 |
| 783 Molokai | Thermal | 1987 | 3 | 2 | 1,467 | 10,001 | $181 | $264,999 | 27 | 61 |
| Total: 5 · Average | 3.0 | 2.0 | 1,361 | 14,970.4 | $200.4 | $266,979.8 | 55.8 | |||
| Median | 1,400 | $265,000 | ||||||||
Closed Properties (5)
Closed Comparables
| Address | City | Year | Date | BD | BTH | SqFt | LotSz | LP | SP | SP/SqFt | SP/LP | DIM | Score |
|---|---|---|---|---|---|---|---|---|---|---|---|---|---|
| 2655 Sea Wind Avenue | Thermal | 1978 | 12/30/2025 | 3 | 2 | 1,248 | 10,022 | $245,900 | $236,000 | $189 | 0.96 | 57 | 72 |
| 2469 Shore Life Avenue | Thermal | 2005 | 10/15/2026 | 3 | 2 | 1,295 | 10,052 | $265,000 | $255,000 | $197 | 0.96 | 34 | 70 |
| 2327 Brentwood Avenue | Thermal | 1987 | 10/06/2026 | 3 | 2 | 1,152 | 11,169 | $249,000 | $249,000 | $216 | 1.00 | 139 | 70 |
| 1064 Treasure Drive | Thermal | 1992 | 06/15/2026 | 3 | 2 | 1,300 | 10,888 | $279,000 | $289,000 | $222 | 1.04 | 61 | 68 |
| 2342 Sand Jewel Avenue | Thermal | 1988 | 11/25/2025 | 3 | 2 | 1,300 | 10,101 | $249,000 | $245,000 | $188 | 0.98 | 280 | 67 |
| Total: 5 · Average | 3.0 | 2.0 | 1,259 | 10,446.4 | $254,800 | $254,800 | $202.4 | — | 114.2 | ||||
| Median | 1,295 | $249,000 | $249,000 | ||||||||||
Market Analysis
List vs Sale $/SqFt
Sale Price Trend
Days on Market
Sale vs List Price
This analysis was generated automatically from MLS data. For an in-depth, human-reviewed valuation, contact Joseph Sardella at josephsardella@gmail.com.