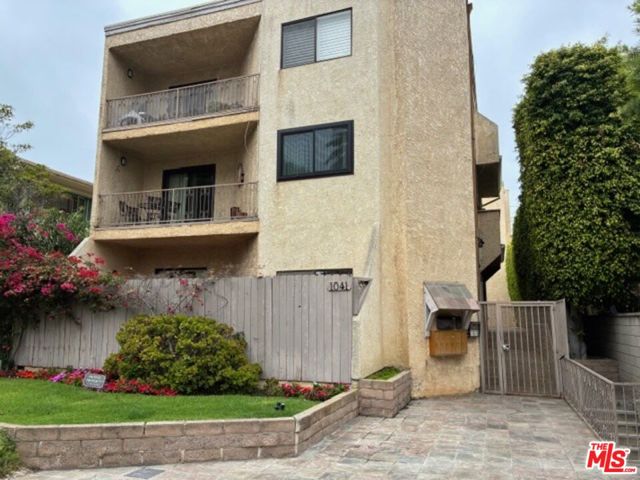
1041 2nd Street, 5, Santa Monica, CA 90403
1041 2nd Street, 5, Santa Monica, CA 90403
Property Description
Great location ,walking distance to 3rd Street Promenade ,downtown Santa Monica shops and restaurants ,Ocean Ave and beach bluffs. It is fix-upper price, One level -mid floor with bright and light unit .open-floor plan with living and dinnig area combine , Very good size Master bedroom . SXS Waher & Dryer closet , also gated undergound common garage with 2 SXS parking space. sold " AS IS" , Fireplace is decorative only ,can not burn woods. Showings by appointment only
Features & Amenities
Property Details
Mortgage Calculator
Current Rates
Comparative Market Analysis
Affordable Tier · 5 active · 5 closed
Santa Monica · Condominium
Listed in line with the median closed sale of $1,290,000. Price per sqft ($870) is a 18% discount to closed comps ($1,057). Closed comps sold at 100% of list — strong seller's market.
Price Position
Aligned with the market — fair pricing for the comps.
Active Properties (5)
Active Comparables
| Address | City | Year | BD | BTH | SqFt | LotSz | LP/SqFt | LP | DIM | Score |
|---|---|---|---|---|---|---|---|---|---|---|
| 1247 10th Street | Santa Monica | 1982 | 2 | 2 | 1,505 | 7,479 | $763 | $1.15M | 146 | 86 |
| 1133 9th Street | Santa Monica | 1982 | 2 | 2 | 1,418 | 30,017 | $775 | $1.10M | 2 | 84 |
| 1012 10th Street | Santa Monica | 1974 | 2 | 3 | 1,614 | 7,508 | $774 | $1.25M | 34 | 83 |
| 450 San Vicente Boulevard | Santa Monica | 1980 | 2 | 2 | 1,289 | 14,444 | $970 | $1.25M | 72 | 79 |
| 415 Montana Avenue | Santa Monica | 1973 | 2 | 2 | 1,087 | 15,014 | $1,140 | $1.24M | 52 | 77 |
| Total: 5 · Average | 2.0 | 2.2 | 1,382.6 | 14,892.4 | $884.4 | $1.20M | 61.2 | |||
| Median | 1,418 | $1.24M | ||||||||
Closed Properties (5)
Closed Comparables
| Address | City | Year | Date | BD | BTH | SqFt | LotSz | LP | SP | SP/SqFt | SP/LP | DIM | Score |
|---|---|---|---|---|---|---|---|---|---|---|---|---|---|
| 928 7th Street | Santa Monica | 1981 | 08/28/2026 | 3 | 3 | 1,590 | 7,491 | $1.40M | $1.38M | $868 | 0.99 | 37 | 89 |
| 930 3rd Street | Santa Monica | 1963 | 04/15/2026 | 2 | 2 | 1,283 | 15,011 | $1.50M | $1.43M | $1,111 | 0.95 | 61 | 77 |
| 930 3rd Street | Santa Monica | 1963 | 11/17/2025 | 2 | 2 | 1,355 | 15,011 | $1.15M | $1.15M | $848 | 1.00 | 111 | 75 |
| 101 California Avenue | Santa Monica | 1964 | 04/16/2026 | 1 | 2 | 1,077 | 18,751 | $1.30M | $1.29M | $1,198 | 0.99 | 98 | 71 |
| 817 6th Street | Santa Monica | 1949 | 11/07/2025 | 2 | 2 | 1,004 | 7,484 | $1.17M | $1.26M | $1,260 | 1.09 | 33 | 69 |
| Total: 5 · Average | 2.0 | 2.2 | 1,261.8 | 12,749.6 | $1.30M | $1.30M | $1,057 | — | 68 | ||||
| Median | 1,283 | $1.29M | $1.29M | ||||||||||
Market Analysis
List vs Sale $/SqFt
Sale Price Trend
Days on Market
Sale vs List Price
This analysis was generated automatically from MLS data. For an in-depth, human-reviewed valuation, contact Joseph Sardella at josephsardella@gmail.com.