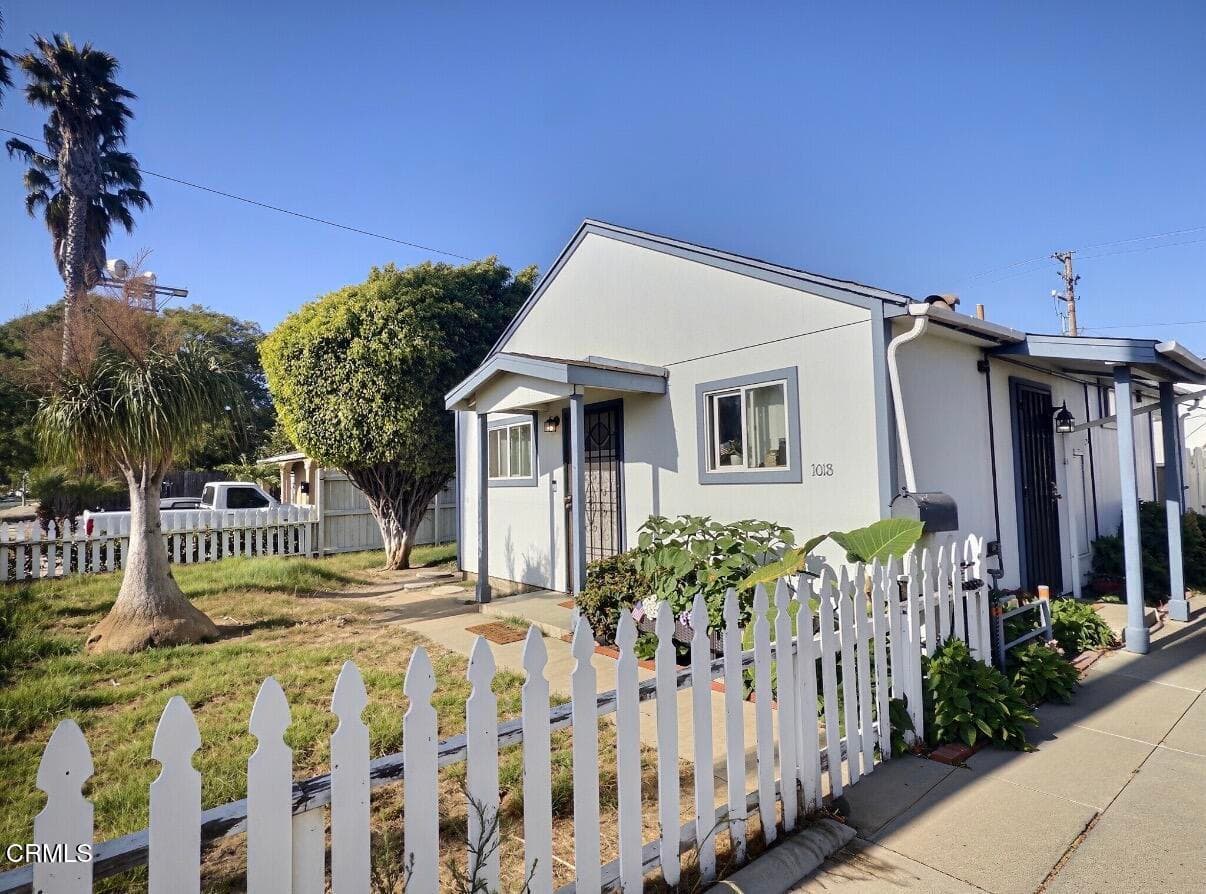
1018 South C Street, Oxnard, CA 93030
1018 South C Street, Oxnard, CA 93030
Property Description
Charming single-family home situated on a spacious lot near Historic Downtown Oxnard. The property offers a comfortable floor plan with plenty of potential to update, personalize, and make it your own. Enjoy convenient access to downtown restaurants, shopping, schools, parks, public transportation, and major commuter routes. The generous outdoor space may provide room for a future ADU, expansion, additional parking, or a private garden, subject to City approval and buyer verification. The duplex next door is also available for sale by the same owner, offering a unique opportunity to purchase neighboring properties separately or together. Please do not disturb occupants.
Features & Amenities
Property Details
Mortgage Calculator
Current Rates
Comparative Market Analysis
Affordable Tier · 5 active · 5 closed
Oxnard: Other - 0031 · Oxnard · Single Family Residence
Listed in line with the median closed sale of $635,000. Price per sqft ($923) is a 68% premium to closed comps ($551). Closed comps sold at 104% of list — strong seller's market.
Price Position
Aligned with the market — fair pricing for the comps.
Active Properties (5)
Active Comparables
| Address | City | Year | BD | BTH | SqFt | LotSz | LP/SqFt | LP | DIM | Score |
|---|---|---|---|---|---|---|---|---|---|---|
| 210 Harding Avenue | Oxnard | 1950 | 3 | 1 | 1,071 | 3,920 | $593 | $635,000 | 105 | 64 |
| 2100 Geneva Way | Oxnard | 1962 | 3 | 2 | 1,049 | 5,662 | $634 | $665,000 | 8 | 58 |
| 29 Elfin Green | Port Hueneme | 1964 | 3 | 2 | 992 | 3,049 | $595 | $589,900 | 89 | 57 |
| 2044 San Jose Street | Oxnard | 1963 | 3 | 1 | 1,023 | 4,379 | $683 | $699,000 | 6 | 56 |
| 2633 Galleon Avenue | Port Hueneme | 1978 | 2 | 1 | 998 | 3,920 | $566 | $565,000 | 111 | 56 |
| Total: 5 · Average | 2.8 | 1.4 | 1,026.6 | 4,186 | $614.2 | $630,780 | 63.8 | |||
| Median | 1,023 | $635,000 | ||||||||
Closed Properties (5)
Closed Comparables
| Address | City | Year | Date | BD | BTH | SqFt | LotSz | LP | SP | SP/SqFt | SP/LP | DIM | Score |
|---|---|---|---|---|---|---|---|---|---|---|---|---|---|
| 1030 Ilena Street | Oxnard | 1949 | 04/29/2026 | 2 | 1 | 830 | 6,098 | $550,000 | $635,000 | $765 | 1.16 | 55 | 74 |
| 653 G Street | Oxnard | 1932 | 05/05/2026 | 2 | 1 | 1,232 | 6,969 | $725,000 | $730,000 | $593 | 1.01 | 32 | 64 |
| 550 G Street | Oxnard | 1933 | 04/17/2026 | 2 | 1 | 1,245 | 6,534 | $749,000 | $744,000 | $598 | 0.99 | 53 | 63 |
| 945 E Street | Oxnard | 1944 | 06/30/2026 | 3 | 2 | 1,506 | 6,969 | $499,900 | $585,000 | $388 | 1.17 | 19 | 58 |
| 1010 Ilena Street | Oxnard | 1949 | 01/07/2026 | 3 | 2 | 1,413 | 6,098 | $649,000 | $580,000 | $410 | 0.89 | 61 | 53 |
| Total: 5 · Average | 2.4 | 1.4 | 1,245.2 | 6,533.6 | $654,800 | $654,800 | $550.8 | — | 44 | ||||
| Median | 1,245 | $635,000 | $635,000 | ||||||||||
Market Analysis
List vs Sale $/SqFt
Sale Price Trend
Days on Market
Sale vs List Price
This analysis was generated automatically from MLS data. For an in-depth, human-reviewed valuation, contact Joseph Sardella at josephsardella@gmail.com.